Gate Research: Crypto Market Remains Range-Bound, SUI Trend Strategy Yields Over 285%
Summary
- ETH outperformed BTC, supported by both price structure and ETF inflows, showing stronger continuity and upside potential.
- The long-short ratio declined in tandem, indicating weakened willingness to chase long positions, with sentiment leaning cautious; the short-term outlook remains consolidation-focused.
- Open interest and funding rates stayed elevated yet stable, suggesting leverage participation has not overheated and the market structure remains relatively healthy.
- Liquidation data showed no extreme clearances; long-short rotations helped reset sentiment and laid the groundwork for the next stage of market momentum.
- On the quantitative strategy side, the Moving Average Convergence Breakout Strategy delivered over 285% returns in SUI, demonstrating strong short-term trading potential.
Market Overview
To systematically present the shifts in capital behavior and trading structure within the cryptocurrency market, this report focuses on five key dimensions: the price volatility of Bitcoin and Ethereum, the long-short ratio (LSR), open interest, funding rates, and liquidation data. These five indicators encompass price trends, market sentiment, and risk conditions, providing a comprehensive view of current trading intensity and structural characteristics. The following sections analyze recent developments in each of these indicators since August 5.
1. Price Volatility Analysis of Bitcoin and Ethereum
According to CoinGecko data, from August 5 to 18 the cryptocurrency market overall exhibited a high-level consolidation pattern. After reaching new local highs in the prior period, both BTC and ETH entered sideways ranges, with short-term momentum slowing yet maintaining a broadly bullish structure.
In terms of price action, BTC reached a new high of 124,400 USDT on August 14, but was repeatedly capped near 119,000 USDT, forming a clear consolidation range at elevated levels. As shown in Figure 1, its price oscillated around this zone, with multiple failed breakout attempts. Both momentum and trading volume weakened simultaneously, reflecting insufficient follow-through buying interest. By contrast, ETH climbed steadily from 4,300 USDT, approaching the 4,800 USDT mark while riding its short-term moving averages upward. This price action shows stronger continuity and a healthier technical structure.【1】【2】【3】
From a fundamentals perspective, ETH spot ETFs recorded $2.85 billion in net inflows last week, setting a new historical high. Inflows were concentrated in BlackRock and Fidelity products, signaling a significant increase in institutional demand for ETH allocations. BTC ETFs remained broadly stable but faced net outflows in some products, underscoring growing structural divergence. Overall, sustained ETF inflows reinforce institutional recognition of major assets and their medium- to long-term allocation value.【4】
In summary, the cryptocurrency market is currently holding a high-level consolidation in the short term. BTC lacks a clear directional breakout, whereas ETH’s technical structure remains solid, with momentum being released gradually. Coupled with continuous inflows into spot ETFs, ETH enjoys stronger support. If trading volume and volatility expand in tandem, ETH may be positioned to lead the next breakout. It is recommended to closely monitor ETF fund flows and whether ETH can hold above the 4,000 USDT key level as signals for the onset of the next trend.
Figure 1: BTC reached a new high of 124,400 USDT on August 14 but was repeatedly capped near 119,000 USDT, with weakening momentum.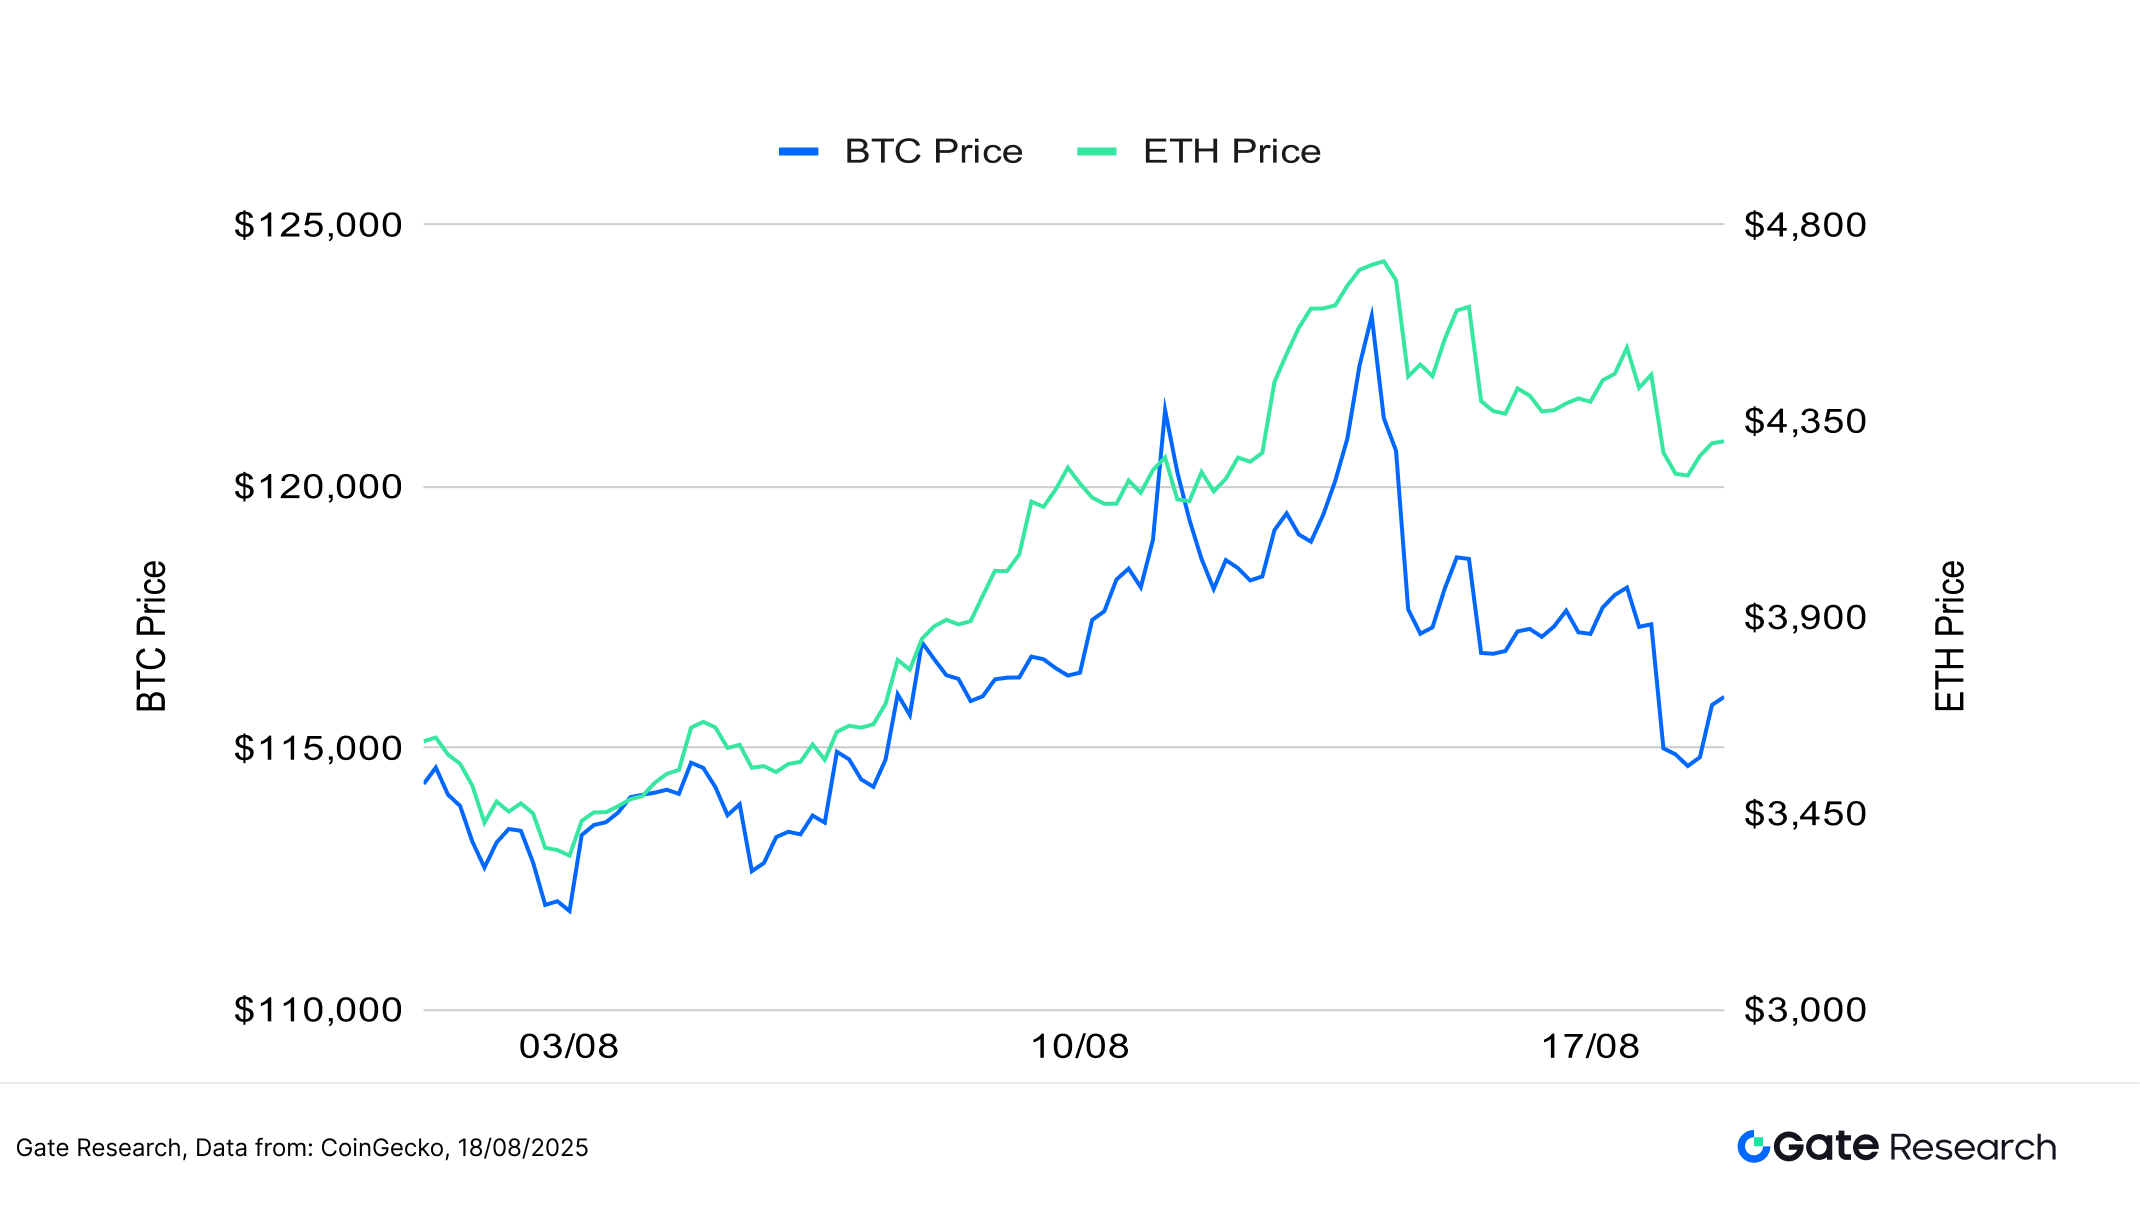
From a volatility perspective, BTC has largely remained in mild consolidation, with only a few trading days showing spikes, indicating that capital flows have been more restrained and trend expectations relatively steady. In contrast, ETH’s volatility has been noticeably more active, with significant surges across multiple sessions, reflecting heightened market sentiment and frequent short-term positioning battles.
Although overall volatility is still at moderate-to-low levels, ETH’s frequent surges suggest it is more susceptible to news or liquidity-driven moves. If accompanied by rising trading volume, this could potentially translate into a meaningful breakout.
Figure 2: BTC volatility remains mild, while ETH experiences frequent spikes, reflecting more sensitive trading sentiment.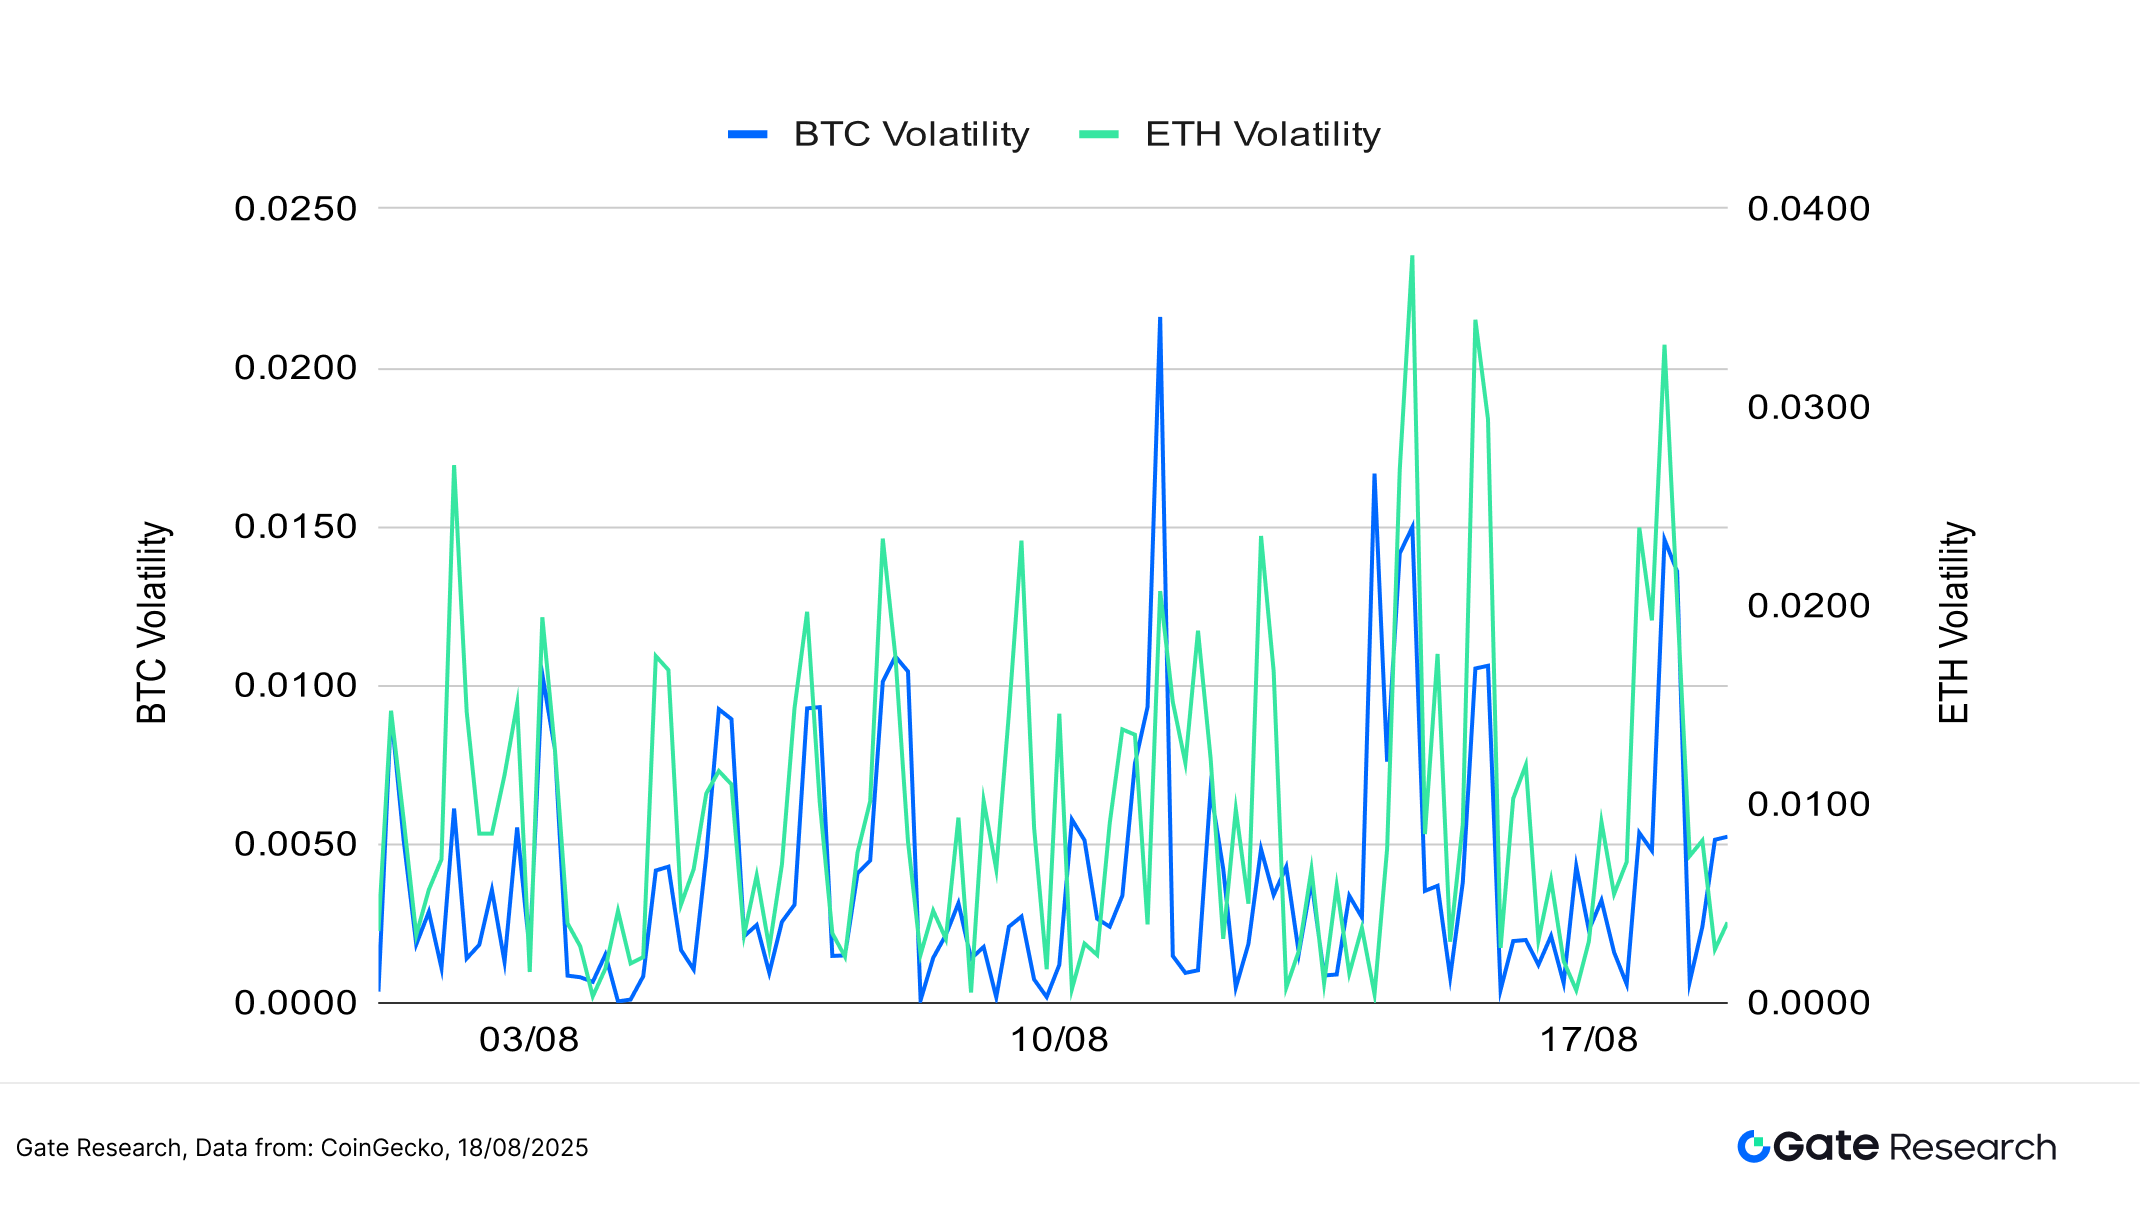
Over the past two weeks, the cryptocurrency market has maintained a high-level consolidation pattern. BTC’s short-term momentum has weakened and its direction remains unclear, while ETH has continued its upward structure, showing relative strength both technically and in capital flows. In terms of volatility, ETH has been more responsive, with increased short-term trading activity. If trading volume expands and ETF inflows persist, ETH is likely to lead the market in a breakout move.
2. Analysis of Long/Short Taker Size Ratio (LSR) for Bitcoin and Ethereum
The Long/Short Taker Size Ratio (LSR) is a key indicator that measures the volume of aggressive buying versus aggressive selling, often used to gauge market sentiment and trend strength. An LSR greater than 1 indicates that the volume of market buys (aggressive longs) exceeds that of market sells (aggressive shorts), suggesting a bullish market bias.
According to Coinglass data, BTC’s long-short ratio (LSR) has trended downward overall over the past two weeks. Although prices remained in a high-level consolidation range, the ratio continued to fall, dropping sharply below 0.90 on August 17. This reflects a significant weakening in the willingness to chase longs, as short-term capital shifted to the sidelines or leaned bearish. While BTC’s high-level structure remains intact, sentiment support has been fading.【5】
ETH’s LSR followed a similar trajectory. Despite ETH prices steadily climbing above 4,300 USDT since early August, the ratio has gradually slid from its peak, hovering near 0.90 in recent days. This indicates that capital positioning has turned noticeably conservative during the rally. Some traders have opted to build short positions to probe downside risks, creating a divergence where prices rise but sentiment lags behind.
Overall, with both BTC and ETH consolidating at high levels, the synchronized decline in LSR underscores lingering doubts about the sustainability of further upside. In the short term, if the LSR fails to recover meaningfully, it may constrain additional upward momentum. Conversely, a rebound above 1.0 would serve as a key leading signal for the continuation of the rally.
Figure 3: BTC price consolidating at high levels while the long-short ratio continues to decline, reflecting significantly weaker willingness to chase longs.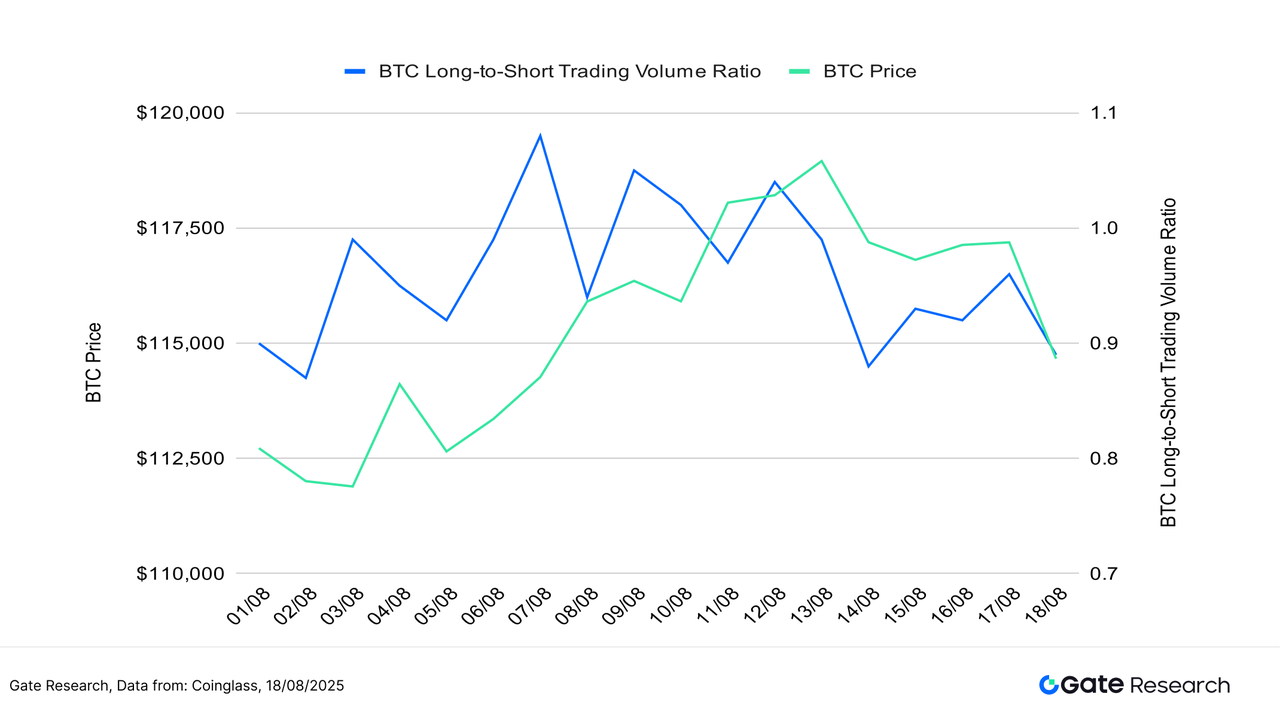
Figure 4: ETH long-short ratio declines in tandem with BTC, with sentiment failing to strengthen alongside price gains, as short-term capital turns more cautious.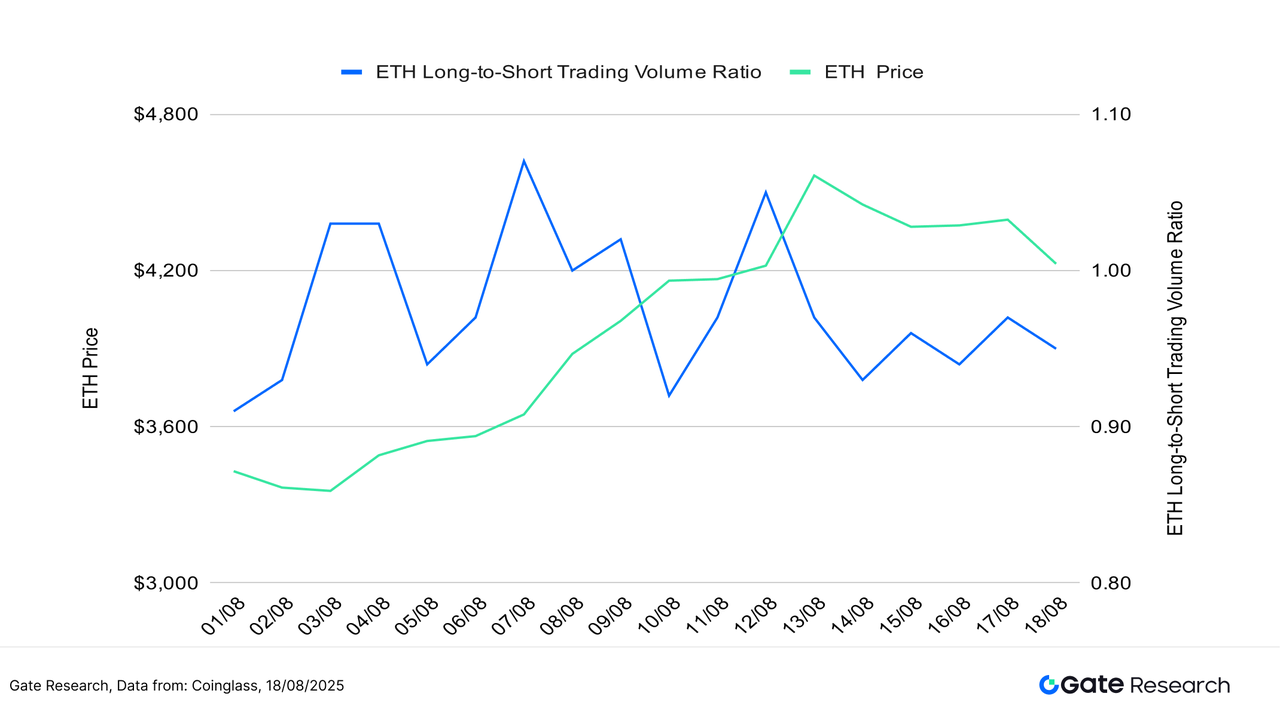
3. Open Interest Analysis
According to Coinglass data, BTC and ETH open interest remained at relatively elevated levels over the past two weeks, indicating that leveraged capital has not yet exited the market and competitive positioning continues. ETH open interest surged rapidly from early August, reaching a local peak of $65.7 billion around August 12 before pulling back slightly, though overall levels remained above the prior average. BTC open interest, meanwhile, first dipped and then recovered, climbing steadily after August 10 to $84.2 billion. Its trajectory largely mirrored ETH’s but with more moderate growth.【6】
Overall, ETH’s faster growth in open interest compared to BTC reflects a more aggressive leveraged positioning on its outlook, aligning with the strong uptrend in spot prices. While current open interest remains at a broadly healthy level, the combination of high prices and elevated leverage suggests that sudden market volatility could pose risks of concentrated liquidations or sharp pullbacks.
Figure 5: BTC and ETH open interest fluctuating at elevated levels, with ETH growth outpacing BTC and leveraged capital remaining active.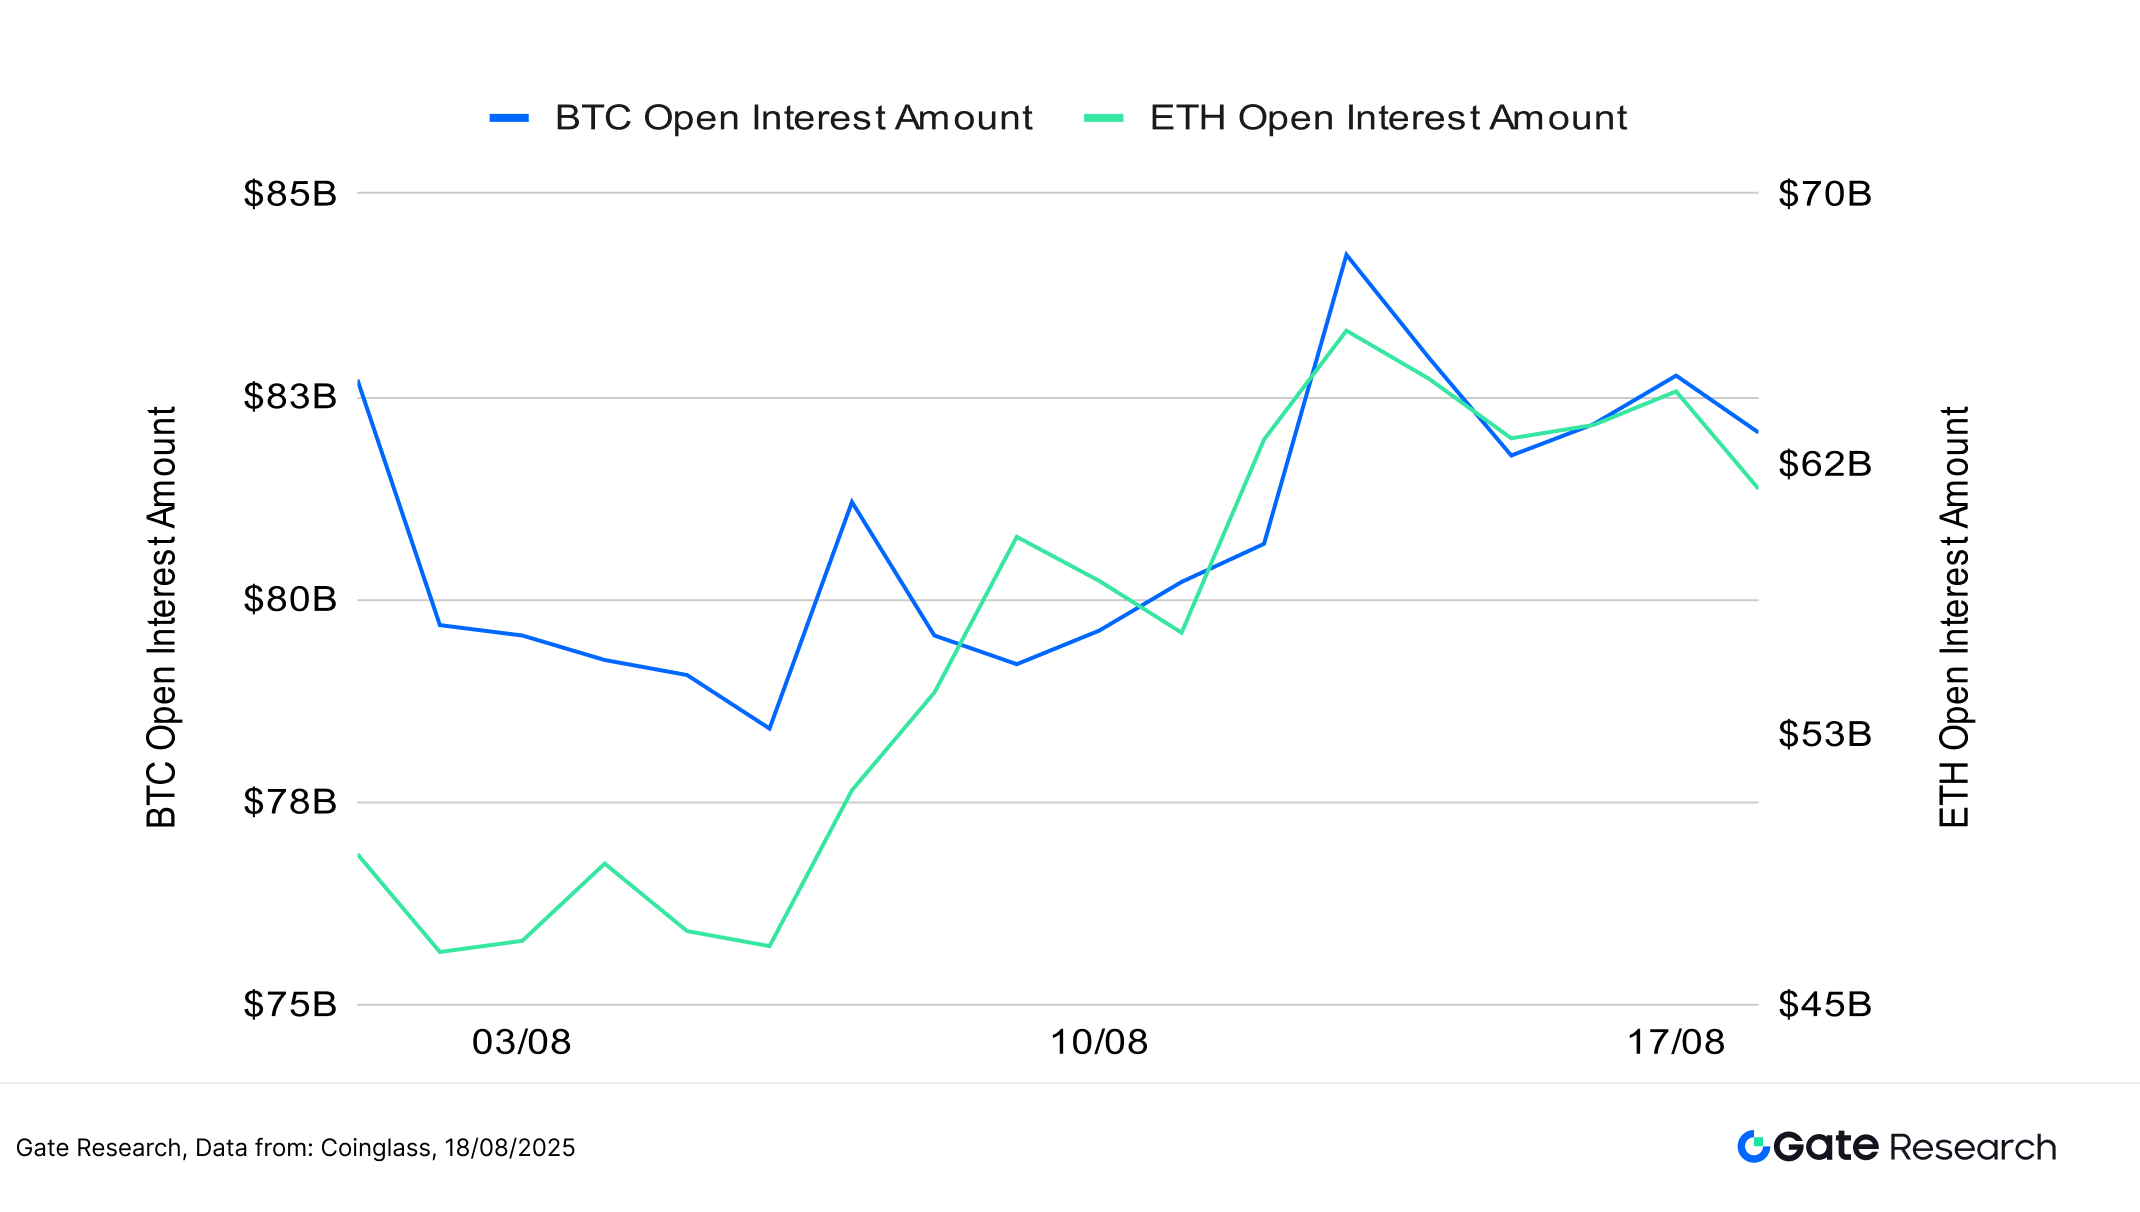
4. Funding Rate
Over the past two weeks, BTC and ETH funding rates have largely fluctuated around the zero axis, indicating an ongoing tug-of-war between longs and shorts and a cautious stance among leveraged traders. Although prices remain at relatively high levels, funding rates have yet to turn meaningfully positive, reflecting that the current rally has been driven primarily by spot and low-leverage capital, leaving the market structure relatively stable.
During mid-August, ETH funding rates briefly dipped into negative territory multiple times, suggesting a slight bearish tilt during certain phases, though each instance quickly corrected without triggering sharp reversals. BTC, by contrast, exhibited even smaller fluctuations, with funding rates remaining more stable—underscoring its continued role as a preferred and steady allocation for institutional investors.【7】【8】
Overall, leveraged momentum has not yet been fully released. If funding rates turn positive and sustain an upward trend, accompanied by an increase in trading volume, this could serve as a key signal for a secondary upward leg in the market.
Figure 6: Funding rates oscillating around the zero axis, with the short-term market remaining cautious and momentum yet to be unleashed.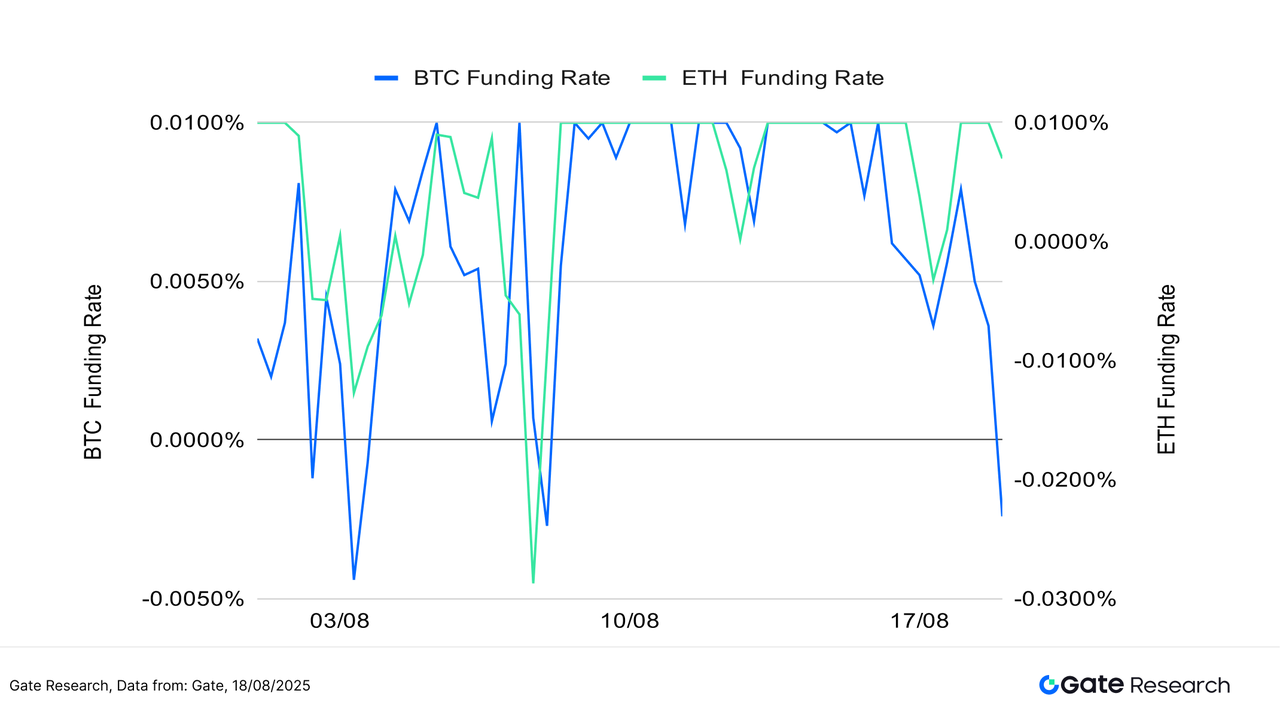
5. Cryptocurrency Liquidation Chart
According to Coinglass data, although the cryptocurrency market has been largely in a high-level consolidation phase over the past two weeks, localized volatility has periodically triggered contract liquidations, forming a structural pattern of balanced tension between long and short positions.
On August 14 and August 18, the notional value of long liquidations surged significantly, exceeding $800 million and $400 million respectively. This reflects how leveraged long positions were forcefully unwound during market pullbacks following rallies, signaling a slowdown in bullish momentum and rising caution across the market. In contrast, short liquidations were concentrated on August 12 and August 13, corresponding to short-term rebounds in price action, where some traders attempting to short the top were forced to cover.【9】
Overall, the current liquidation cycle remains relatively moderate and rotational, with no evidence of cascading chain reactions or panic-driven wipeouts. This suggests that the market has maintained a healthy positioning structure amid consolidation. The alternating liquidations between longs and shorts help flush out short-term sentiment and weak hands, thereby building more solid momentum for the next stage of price action.
Figure 7: Significant spike in long liquidations on August 14 and August 18, reflecting leveraged longs being unwound during post-rally pullbacks, signaling slowing bullish momentum and rising market caution.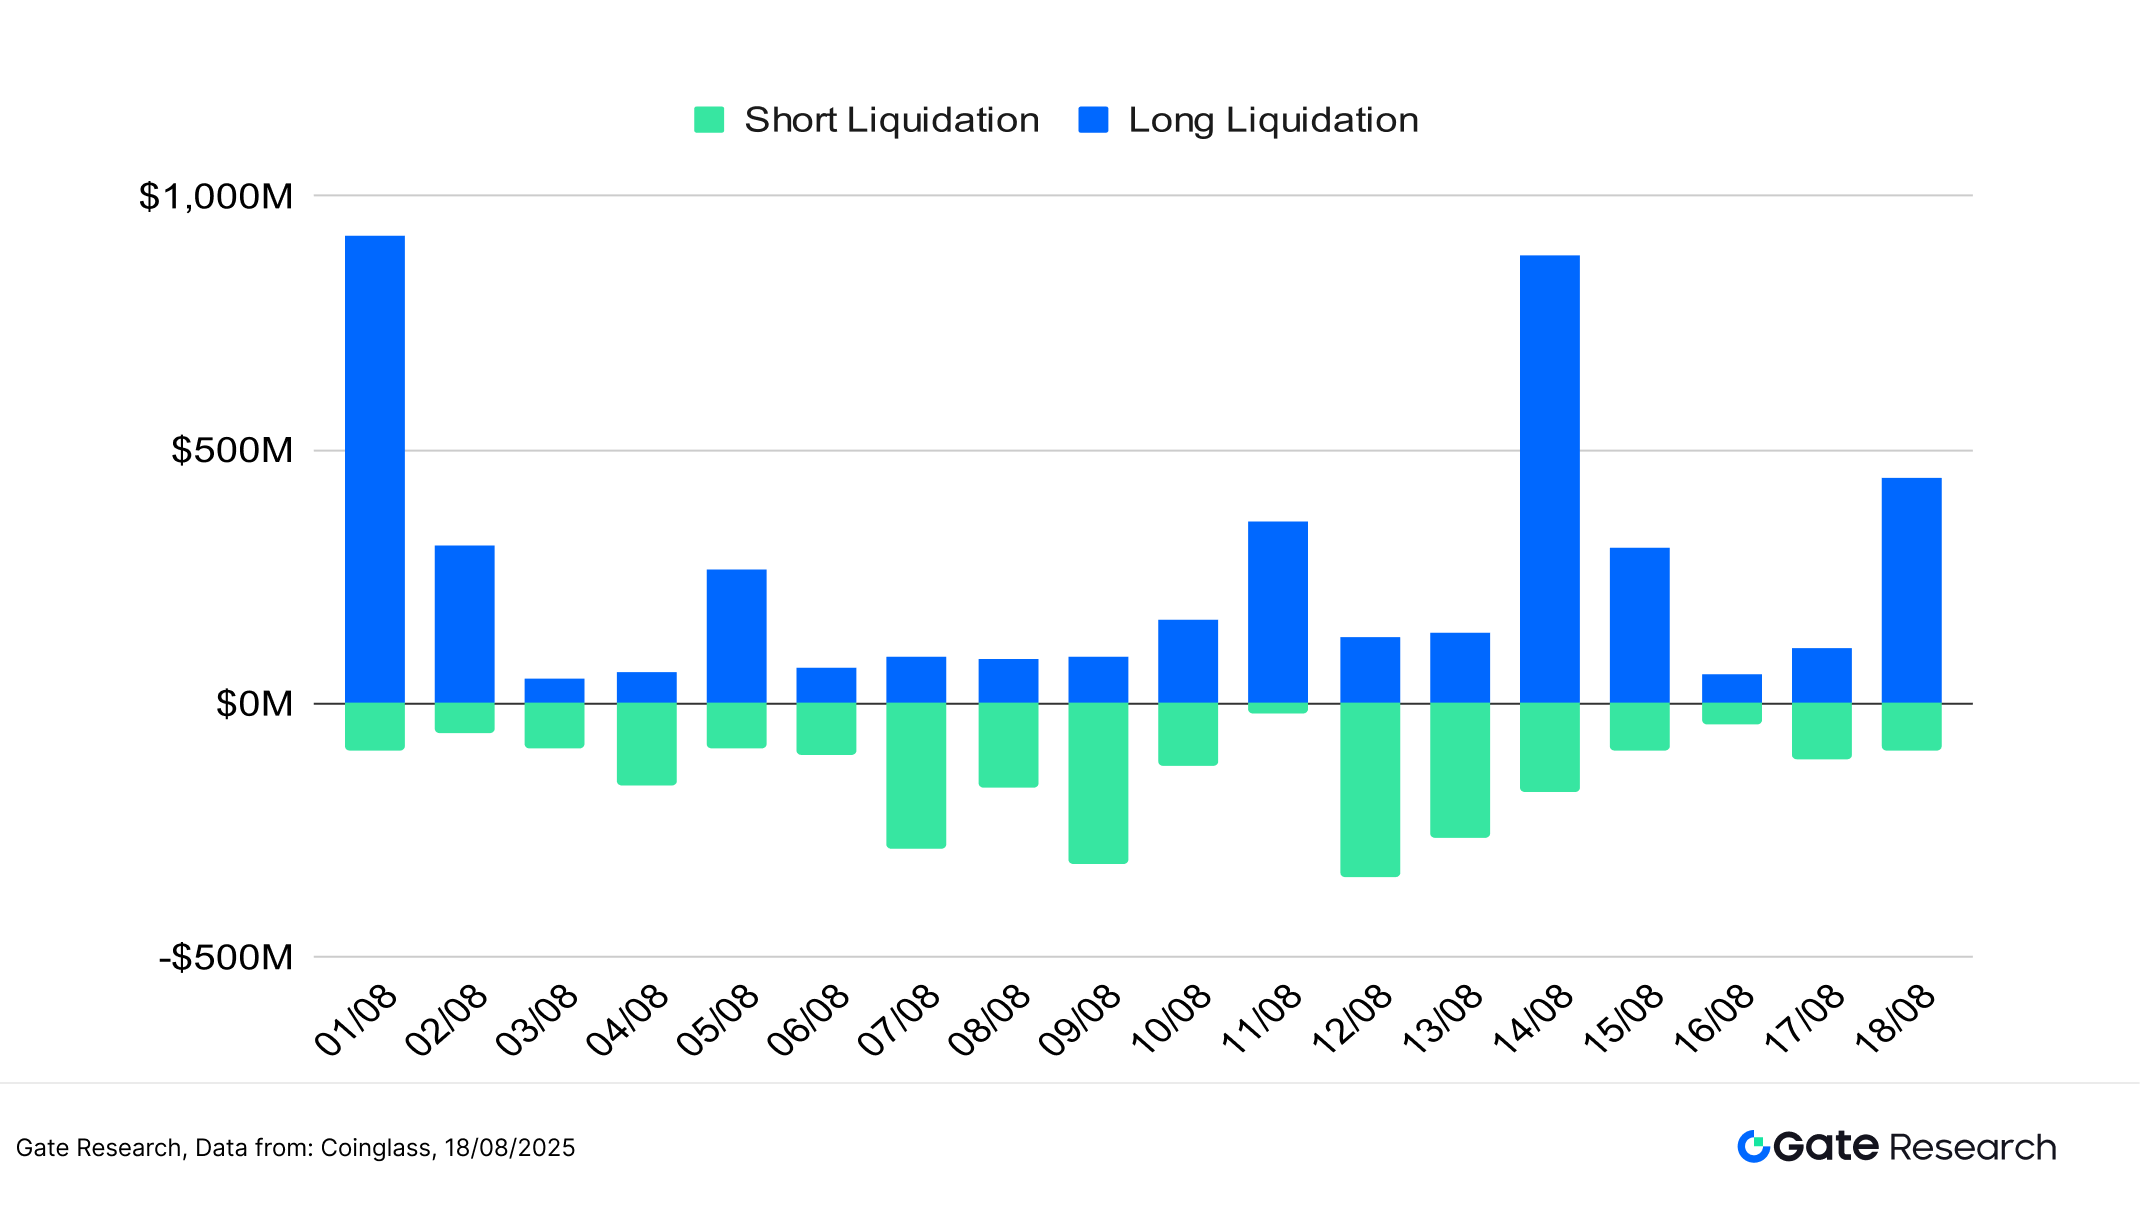
Against the backdrop of high-level consolidation with a structurally bullish bias, overall trading activity in the cryptocurrency market has remained strong, yet short-term capital sentiment has begun to diverge, with leverage positioning turning more cautious. This reflects a coexistence of trend continuity and volatility. Multiple indicators suggest that while BTC and ETH both remain within technically strong zones, data on the long-short ratio, funding rates, and liquidations all point to a weakening willingness to chase prices, with bullish momentum slowing in the short term. In such a complex environment of tug-of-war between long and short positions and heightened sentiment sensitivity, investors must rely more on systematic quantitative indicators to identify trend reversals and shifts in capital structure.
Accordingly, the following section will focus on moving averages as a technical indicator, exploring their effectiveness in identifying trend reversals and capturing entry and exit signals during high-level consolidation and cyclical rotations. Using the “Moving Average Convergence Breakout Strategy” as the core framework, we will backtest its performance across different tokens and market structures to evaluate its adaptability and stability in trend-following, drawdown control, and amplifying mid-trend gains.
Quantitative Analysis – Moving Average Convergence Breakout Strategy
(Disclaimer: All forecasts in this article are based on historical data and market trends and are for informational purposes only. They should not be considered investment advice or a guarantee of future market performance. Investors should carefully assess risks and make prudent decisions when engaging in related investments.)
1. Strategy Overview
The “Moving Average Convergence Breakout Strategy” is a momentum-based approach that combines technical trend analysis. The strategy observes the convergence of multiple short- to medium-term moving averages (such as the 5-day, 10-day, and 20-day) within a specific period to identify potential moments when the market is likely to experience directional volatility. When several moving averages align and move closer together, it typically indicates that the market is in a consolidation phase, awaiting a breakout. At this point, if the price breaks significantly above the moving average cluster, it is considered a bullish signal; conversely, if the price falls below the moving average band, it is viewed as a bearish signal.
To enhance practicality and risk control, the strategy also incorporates fixed take-profit and stop-loss mechanisms, ensuring timely entries and exits when trends emerge, while balancing returns with risk management. Overall, the strategy is designed to capture medium- to short-term trend opportunities, offering both discipline and operability.
2. Core Parameter Settings
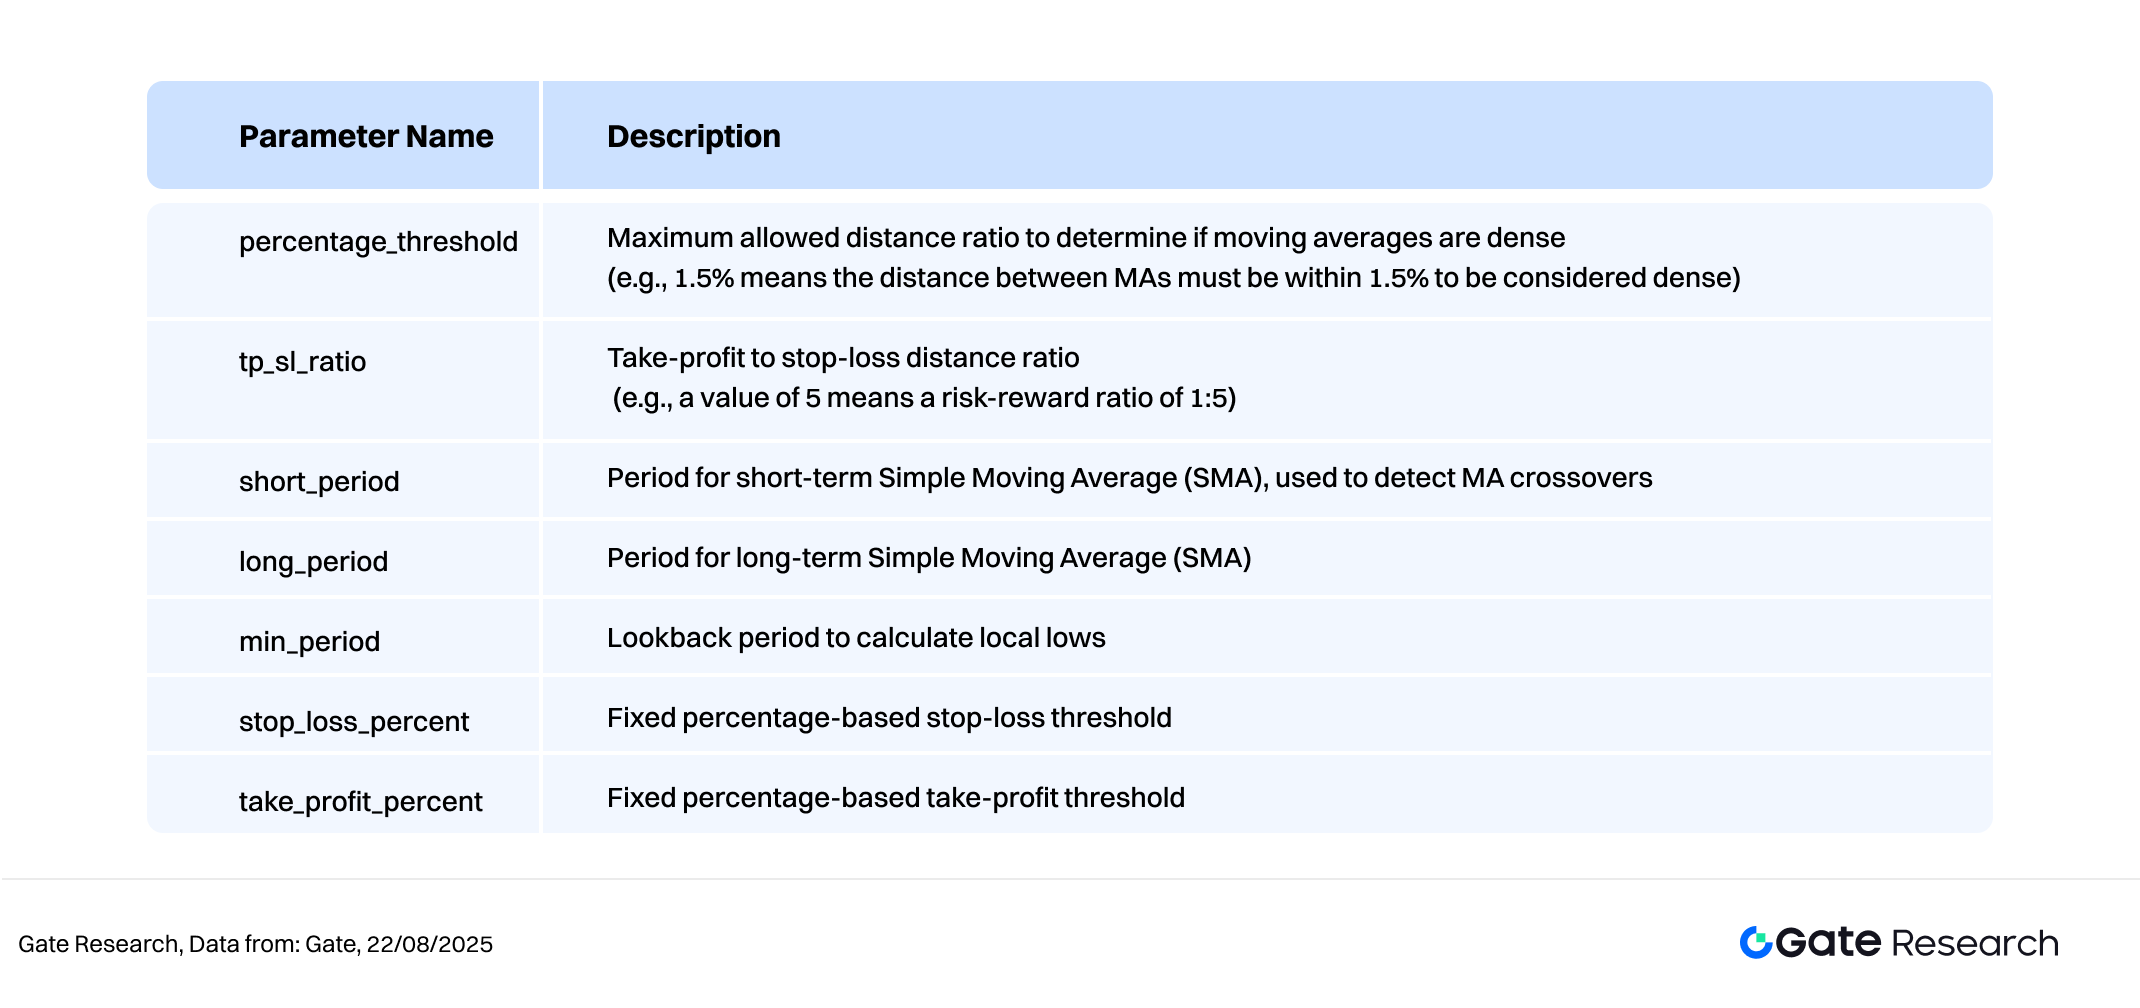
3. Strategy Logic and Operational Mechanism
Entry Conditions
- Moving Average Convergence: Calculate six moving averages—SMA20, SMA60, SMA120, EMA20, EMA60, and EMA120. Determine the distance between the maximum and minimum values of these MAs (referred to as the “MA spread”). When the spread is below a defined threshold (e.g., 1.5% of price), the MAs are considered converged.
Price Breakout Conditions:
When the current price breaks above the highest of the six MAs, it is considered a bullish breakout signal, triggering a buy entry.
- When the current price breaks below the lowest of the six MAs, it is considered a bearish breakout signal, triggering a sell entry.
Exit Conditions
- For Long Positions:
- If the price falls below the lowest MA at the time of entry, a stop-loss is triggered.
If the price rises by more than “(Entry Price – Lowest MA) × Risk/Reward Ratio,” a take-profit is triggered.
For Short Positions:
- If the price rises above the highest MA at the time of entry, a stop-loss is triggered.
- If the price falls by more than “(Highest MA – Entry Price) × Risk/Reward Ratio,” a take-profit is triggered.
Practical Example Chart
- Trading Signal Triggered
The chart below illustrates the most recent entry signal generated on August 12, 2025, for the TRX/USDT 1-hour candlestick chart. After the six MAs converged tightly, the price broke upward, meeting the entry conditions defined by the strategy. The system executed a buy order at the breakout level, successfully capturing the start of the subsequent upward movement.
Figure 8: Illustration of the actual entry point when the TRX/USDT strategy conditions were triggered (August 12, 2025).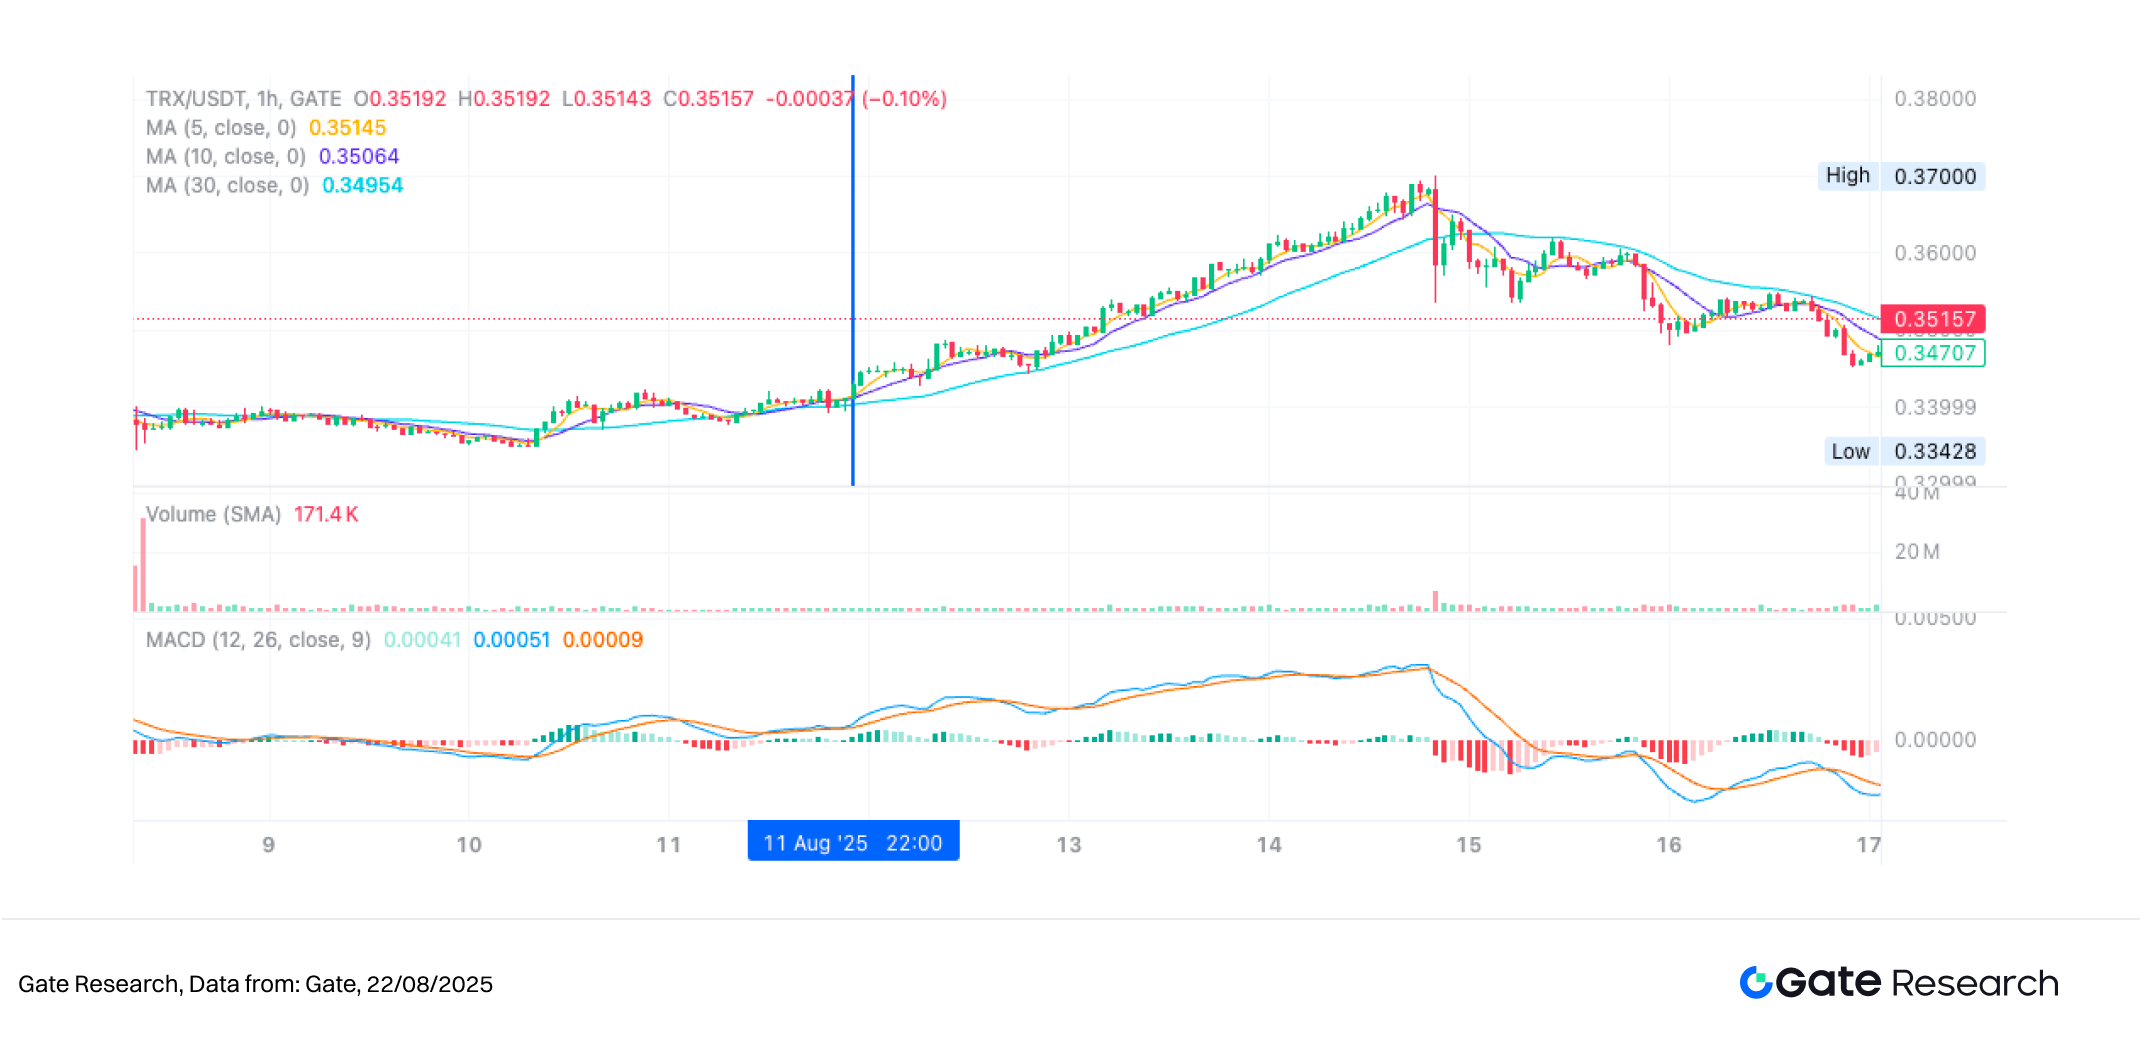
- Trading Action and Outcome
Based on the dynamic take-profit mechanism, the system automatically exited once the preset risk/reward ratio was reached, effectively securing the main portion of the wave’s gains. Although some upside potential remained uncaptured, the overall operation adhered to the strategy’s discipline, demonstrating solid risk control and consistent execution. Incorporating a trailing stop or trend-following mechanism in the future may further extend profit capture in strong trending markets.
Figure 9: Illustration of the TRX/USDT exit point (August 14, 2025).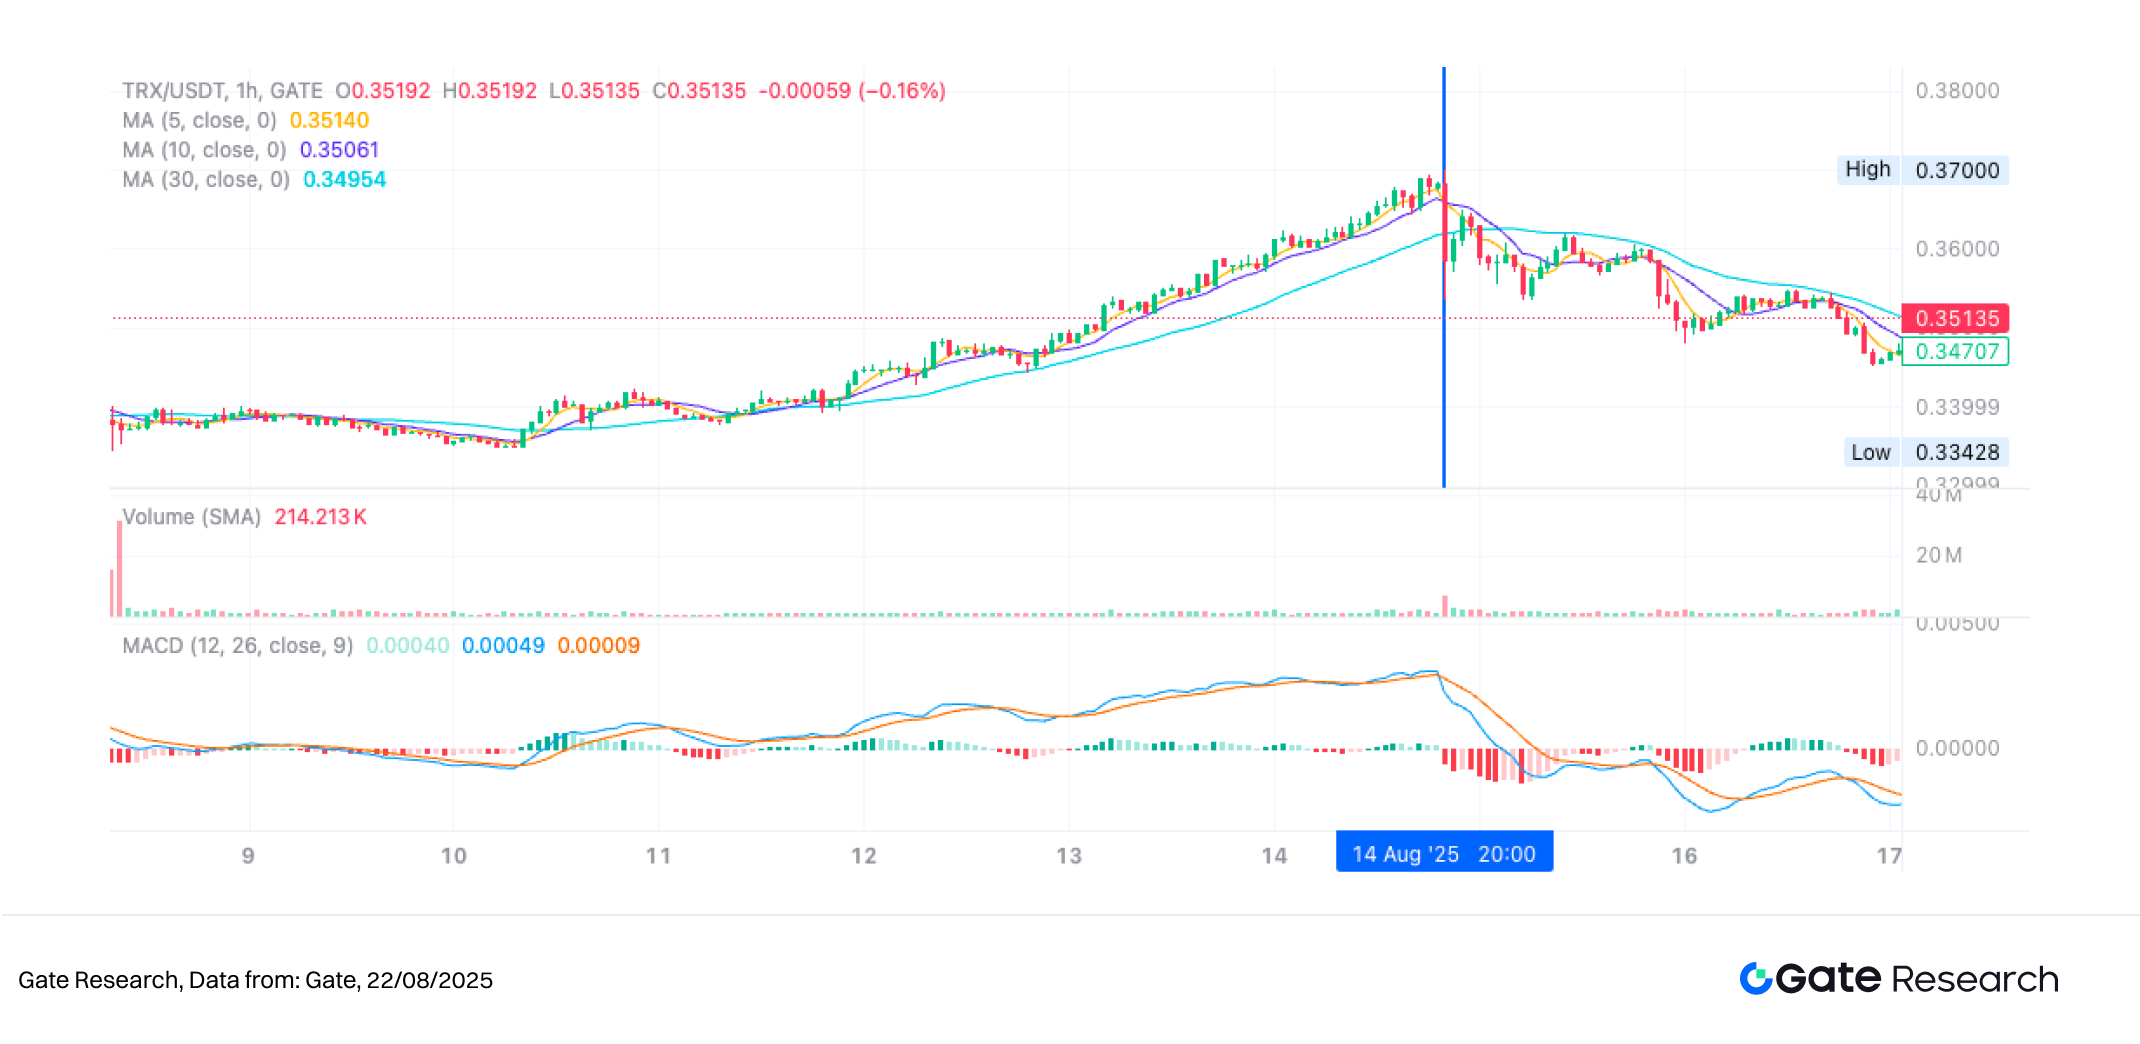
Through the above practical example, we can clearly illustrate how the strategy’s entry logic is triggered by moving average convergence and price breakout conditions, alongside its dynamic take-profit mechanism. By leveraging the interaction between price action and moving average structures, the strategy accurately captured the trend initiation point and exited automatically during subsequent fluctuations, locking in core profits while managing risk. This case study not only validates the strategy’s practicality and execution discipline but also highlights its stability and risk management capabilities in real market conditions, laying the groundwork for future parameter optimization and strategic refinement.
4. Practical Backtesting Example
Parameter Backtesting Setup
To identify the optimal parameter combinations, we conducted a systematic grid search across the following ranges:
tp_sl_ratio: 3 to 14 (step size = 1)threshold: 1 to 19.9 (step size = 0.1)
Taking SUI/USDT as an example, the system tested a total of 2,280 parameter combinations over the past year’s 1-hour candlestick data and selected the five combinations that yielded the highest cumulative returns. Evaluation criteria included annualized return, Sharpe ratio, maximum drawdown, and ROMAD (Return Over Maximum Drawdown) to comprehensively assess strategy performance.
Figure 10: Comparison table of the five best-performing strategy parameter sets.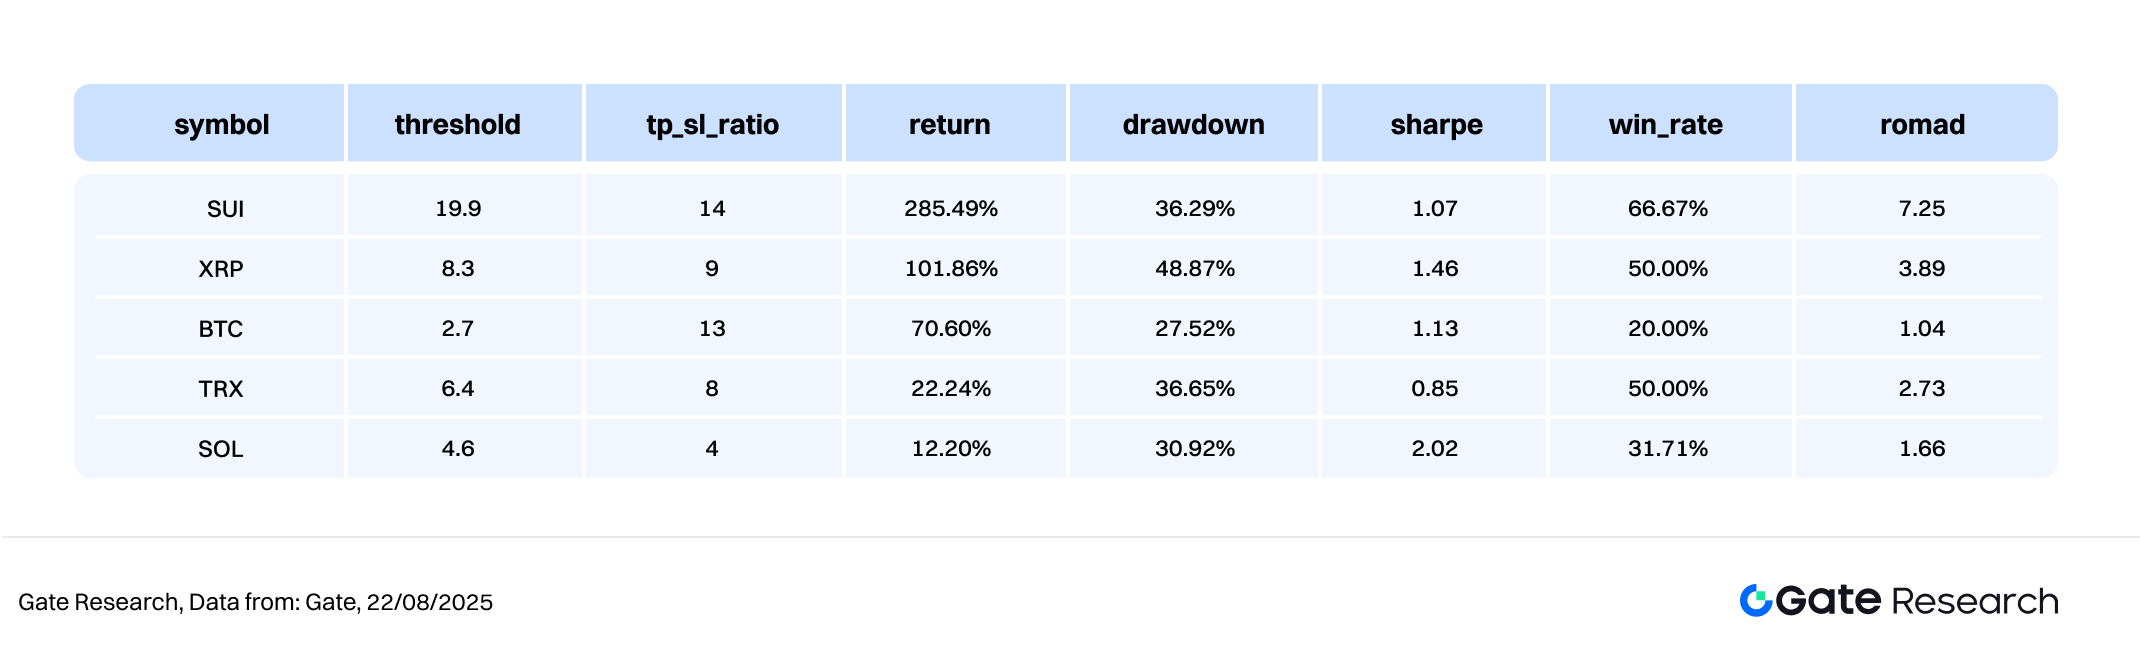
Strategy Logic Description
When the system detects that the distance between the six moving averages has converged to within 19.9% and the price breaks upward through the upper bound of the moving average cluster, a buy signal is triggered. This setup is designed to capture the moment when the price is about to initiate a breakout. The entry is made at the current price, with the highest moving average at the breakout point serving as the reference for dynamic take-profit, thereby enhancing return management.
The strategy is configured as follows:
percentage_threshold= 19.9 (maximum spread limit among the six moving averages)tp_sl_ratio= 14 (dynamic take-profit ratio)short_period= 6,long_period= 14 (observation periods for moving averages)
Performance and Results Analysis
The backtesting period spans from August 1, 2024, to August 18, 2025. This parameter set demonstrated strong performance across multiple tokens. For example, in SUI, the cumulative return reached 285.49%, with a maximum drawdown of 36.29% and a ROMAD of 7.25, indicating robust capital appreciation with moderate risk control. In the case of XRP, despite a relatively higher maximum drawdown of 48.87%, the strategy still delivered a return of 101.86%, with a Sharpe Ratio of 1.46, reflecting relatively stable volatility management.
Figure 11: Comparison of cumulative returns of the five best-performing parameter sets over the past year.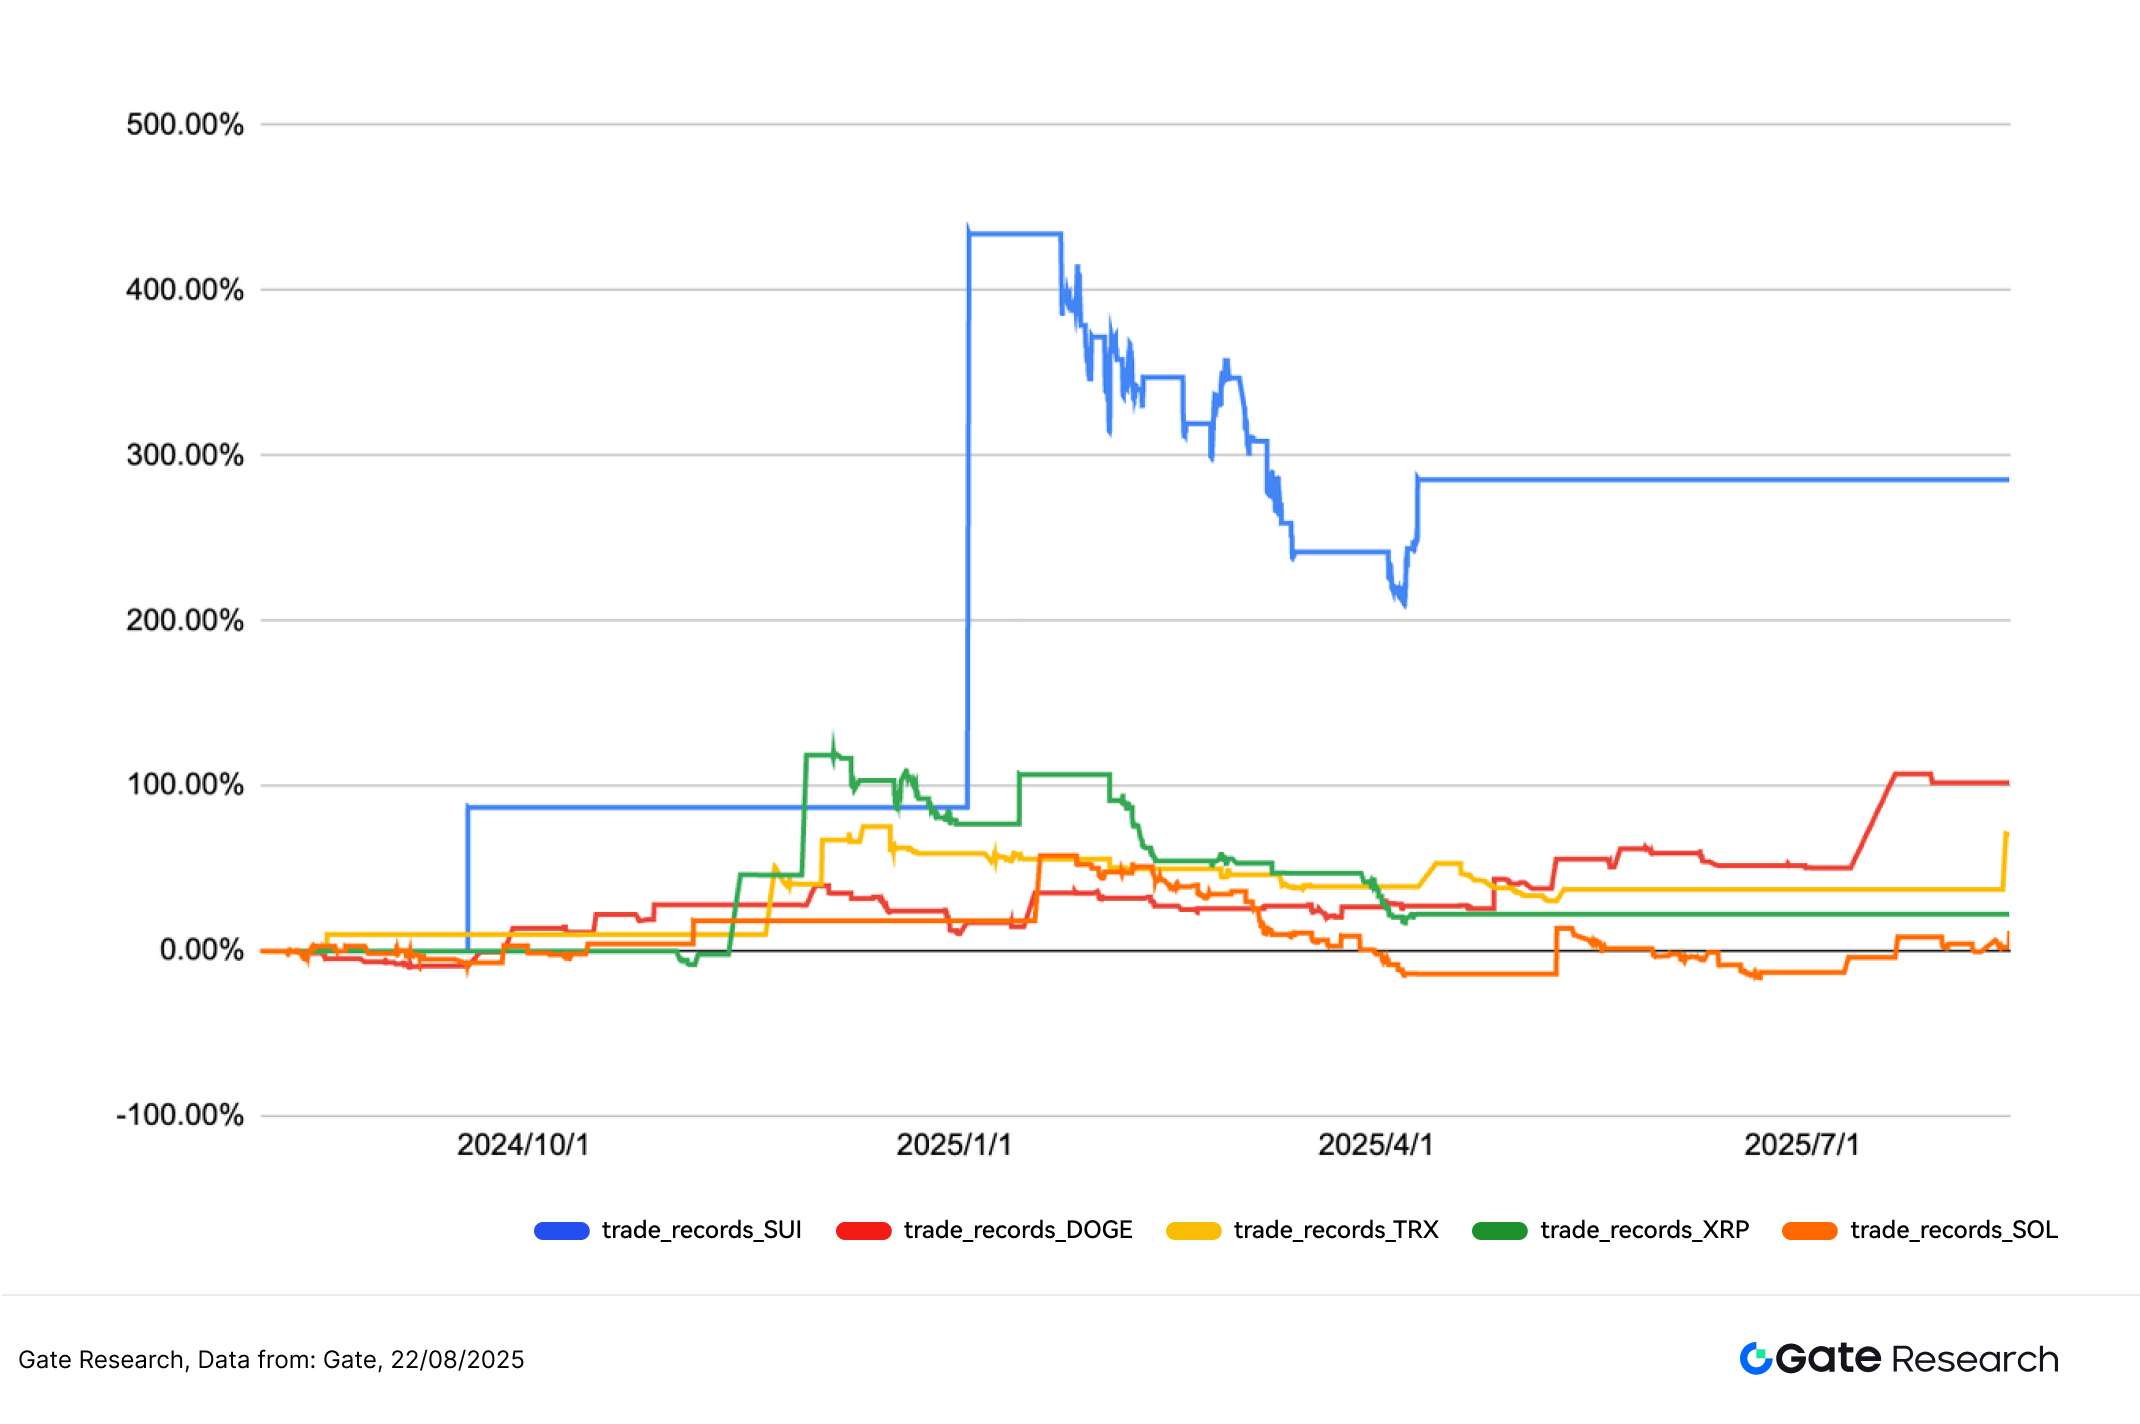
5. Strategy Summary
This study validates that a trend-following strategy based on moving average convergence breakouts demonstrates solid practical potential in moderately to highly volatile cryptocurrency markets. Through clear entry and exit logic combined with robust risk management, the strategy not only outperforms Buy and Hold overall but also delivers strong capital appreciation across multiple major tokens.
In particular, even under conditions of low win rates, the strategy leverages its asymmetric risk-reward profile and strict trading discipline to effectively limit losses, extend holding durations, and accumulate returns in a controlled-risk framework. This highlights its adaptability in uncertain market trends. Looking ahead, integrating multi-factor signals, volume confirmation mechanisms, and dynamic parameter adjustments could further enhance the strategy’s stability and flexibility, while enabling broader deployment across multiple tokens and timeframes.
It is worth noting that the five parameter sets tested in this study generated relatively few trades during the backtesting period, which may affect the statistical robustness and generalizability of the results. Some assets, such as BTC and SOL, exhibited weaker win rates and returns, potentially due to signal thresholds or inherent volatility characteristics. Therefore, future research should consider expanding sample coverage—for instance, by extending the backtesting horizon, incorporating more tokens, or applying different timeframes—to strengthen robustness and improve the reliability of live deployment.
Despite these limitations, the backtest results show that among the five best-performing parameter sets, the current strategy strikes a relatively ideal balance between returns and stability, offering practical application value. If additional factors such as trading volume and volatility are integrated into the signal framework, along with continued optimization of execution logic and capital management rules, the strategy’s adaptability in range-bound markets could improve further, allowing it to deliver consistent performance across broader market environments.
Conclusion
From August 5 to August 18, 2025, the cryptocurrency market as a whole maintained a high-level consolidation structure, with major assets showing strong technical setups. ETH outperformed, supported by record-high net inflows into spot ETFs, which provided mid-term market support. However, based on key indicators such as the long-short ratio, funding rates, and liquidation structure, the willingness to chase long positions weakened, sentiment turned cautious, and the short-term outlook reflected structural consolidation and a redistribution of positions.
Overall, leverage participation had not reached overheated levels. While open interest and funding rates remained elevated, they were stable, suggesting a healthy market structure. Moderate liquidations under long-short rotations helped reset sentiment and flush out weak hands. If trading volume expands further, funding rates stay positive and stable, and momentum factors align, the market may break out of its current consolidation range. Conversely, if capital remains hesitant and volatility contracts, major tokens are likely to extend weak consolidation in the near term.
Against this backdrop, the trend-following strategy built on moving average convergence breakout logic has demonstrated strong real-market potential in moderately to highly volatile environments. Backtest results show that performance in SUI and XRP was particularly impressive, with cumulative returns exceeding 100%.
It should be noted, however, that the five parameter sets tested produced relatively few trades during the backtesting period, which may affect statistical robustness and generalizability. For tokens such as BTC and SOL, performance was relatively muted due to volatility characteristics and limited signal frequency. Overall, the strategy achieved a favorable balance between returns, drawdown control, and execution efficiency, offering live deployment potential. With the integration of additional factors such as trading volume, volatility, or multi-timeframe confluence, as well as more flexible risk management mechanisms, the strategy’s stability and adaptability could be further enhanced.
References:
- CoinGecko, https://www.coingecko.com/
- Gate, https://www.gate.com/trade/BTC_USDT
- Gate, https://www.gate.com/trade/ETH_USDT
- Sosovalue, https://sosovalue.com/assets/etf/us-btc-spot?from=moved
- Coinglass, https://www.coinglass.com/LongShortRatio
- Coinglass, https://www.coinglass.com/BitcoinOpenInterest?utm_source=chatgpt.com
- Gate, https://www.gate.com/futures_market_info/BTC_USD/capital_rate_history
- Gate, https://www.gate.com/futures/introduction/funding-rate-history?from=USDT-M&contract=ETH_USDT
- Coinglass, https://www.coinglass.com/pro/futures/Liquidations
Gate Research is a comprehensive blockchain and cryptocurrency research platform that provides deep content for readers, including technical analysis, market insights, industry research, trend forecasting, and macroeconomic policy analysis.
Disclaimer
Investing in cryptocurrency markets involves high risk. Users are advised to conduct their own research and fully understand the nature of the assets and products before making any investment decisions. Gate is not responsible for any losses or damages arising from such decisions.
Related Articles

Reflections on Ethereum Governance Following the 3074 Saga

Gate Research: BTC Breaks $100K Milestone, November Crypto Trading Volume Exceeds $10 Trillion For First Time

Gate Research: 2024 Cryptocurrency Market Review and 2025 Trend Forecast

NFTs and Memecoins in Last vs Current Bull Markets

Gate Research-A Study on the Correlation Between Memecoin and Bitcoin Prices
