

chainyoda
分享币圈内容,享内容挖矿收益
placeholder
- 赞赏
- 点赞
- 评论
- 转发
- 分享
🎤 支持你的偶像 · Gate 直接带你到爱之代币! 🎶
兄弟,快去Gate Square,现在支持 #TokenOfLove# ——20张音乐节门票在等你!🔥
HyunA / SUECO / DJ KAKA / CLICK#15 — 你最期待谁?让我们一起支持吧!
📌 如何加入 (您加入的方式越多,获胜的几率就越高!)
1️⃣ 与此帖互动
点赞 & 转发 + 投票给你最喜欢的艺术家
评论:“我为Gate Square上的爱情代币加油!”
2️⃣ 门广场邮局
使用标签: #ArtistName# + #TokenOfLove#
发布您喜欢的任何内容:
🎵 你想现场听的歌 + 你的心情
📣 你的支持口号 ( 例如:"HyunA Queen,加油!Gate Square 支持!" )
😎 DIY meme/海报/视频 (奖励积分,赢得的机会更高!)
3️⃣ 在Twitter / 小红书上发布
使用标签: #ArtistName# + #TokenOfLove#
同样的内容,如上所述 + 请在这里填写反馈链接 👉 https://www.gate.com/questionnaire/7008
🎟️ 奖励
8张优质Gate Square出版物的门票
2张门广场邮局的快乐互动票
5 张票用于优质 Twitter 帖子
5张优质帖子在小红书的门票
📌 文章的质量将根据内容的
查看原文兄弟,快去Gate Square,现在支持 #TokenOfLove# ——20张音乐节门票在等你!🔥
HyunA / SUECO / DJ KAKA / CLICK#15 — 你最期待谁?让我们一起支持吧!
📌 如何加入 (您加入的方式越多,获胜的几率就越高!)
1️⃣ 与此帖互动
点赞 & 转发 + 投票给你最喜欢的艺术家
评论:“我为Gate Square上的爱情代币加油!”
2️⃣ 门广场邮局
使用标签: #ArtistName# + #TokenOfLove#
发布您喜欢的任何内容:
🎵 你想现场听的歌 + 你的心情
📣 你的支持口号 ( 例如:"HyunA Queen,加油!Gate Square 支持!" )
😎 DIY meme/海报/视频 (奖励积分,赢得的机会更高!)
3️⃣ 在Twitter / 小红书上发布
使用标签: #ArtistName# + #TokenOfLove#
同样的内容,如上所述 + 请在这里填写反馈链接 👉 https://www.gate.com/questionnaire/7008
🎟️ 奖励
8张优质Gate Square出版物的门票
2张门广场邮局的快乐互动票
5 张票用于优质 Twitter 帖子
5张优质帖子在小红书的门票
📌 文章的质量将根据内容的
- 赞赏
- 点赞
- 评论
- 转发
- 分享
推荐关注
换一批
比特一哥
仅分享个人观点,不构成买卖建议。
比特币教主
欢迎新朋友加入教主
asiftahsin
分享加密货币相关市场分析,分享加密货币相关知识给我的追随者(兄弟姐妹)
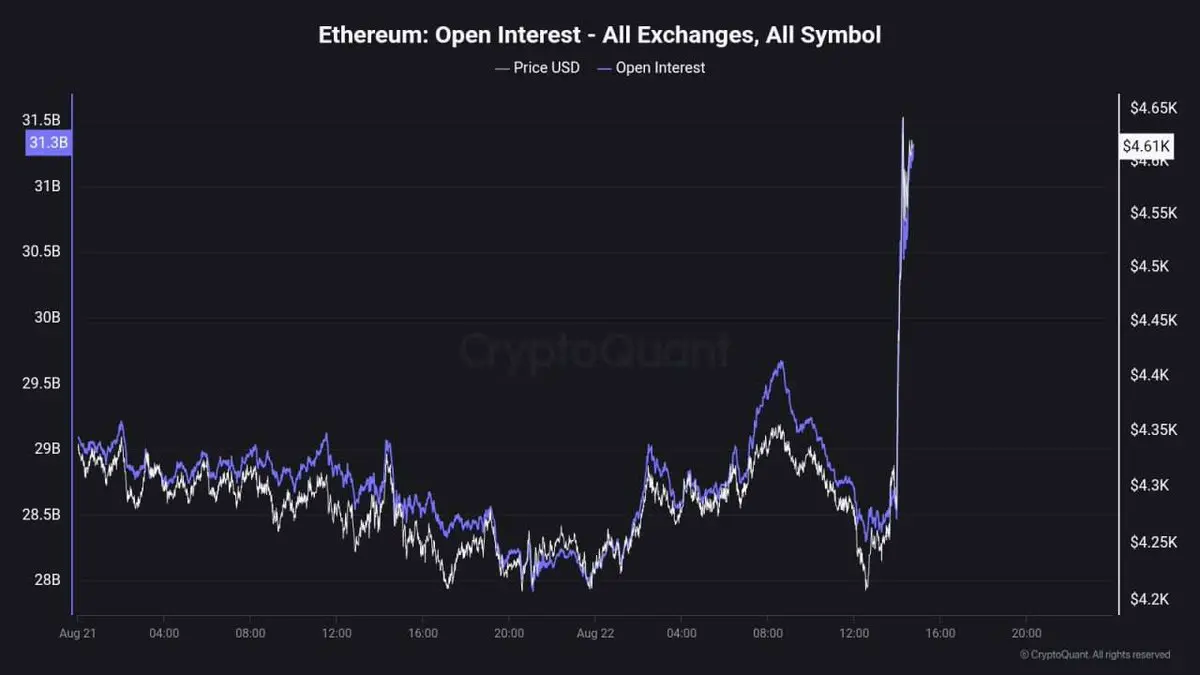
至少$3.18B是基于衍生品的新头寸。
未平仓合约上涨了约~10%。
查看原文未平仓合约上涨了约~10%。
- 赞赏
- 点赞
- 评论
- 转发
- 分享
最后38个🚨🚨🚨🚨🚨🚨🚨🚨
海绵宝宝爱好者快来购买 🥰 🤩
短期内 0.5 Usdt 💸💸🤑🤑
https://www.gate.com/nft/collection/21286/Spronge-Man
查看原文海绵宝宝爱好者快来购买 🥰 🤩
短期内 0.5 Usdt 💸💸🤑🤑
https://www.gate.com/nft/collection/21286/Spronge-Man


- 赞赏
- 18
- 评论
- 转发
- 分享

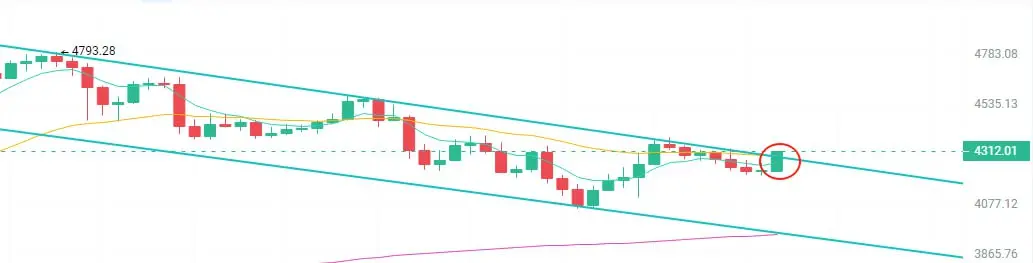
近期加密货币市场呈现积极态势,比特币(BTC)价格展现出强劲上涨势头。从短期走势来看,BTC价格已突破重要技术指标,呈现出明显的多头排列。
技术面上,MACD指标再次形成金叉,且红柱持续增厚,暗示多头力量正在增强。同时,成交量的显着提升进一步佐证了这一上涨趋势的可持续性。基于当前市场态势,分析师预计BTC短期内有望继续保持强势上涨态势,并可能进一步拓展上行空间。
对于以太坊(ETH),市场同样呈现出积极信号。分析显示,ETH也有望在近期内实现一定幅度的上涨。
然而,投资者仍需谨慎,密切关注市场变化,做好风险管理。加密货币市场向来波动剧烈,任何投资决策都应建立在充分的市场研究和个人风险承受能力的基础之上。
查看原文技术面上,MACD指标再次形成金叉,且红柱持续增厚,暗示多头力量正在增强。同时,成交量的显着提升进一步佐证了这一上涨趋势的可持续性。基于当前市场态势,分析师预计BTC短期内有望继续保持强势上涨态势,并可能进一步拓展上行空间。
对于以太坊(ETH),市场同样呈现出积极信号。分析显示,ETH也有望在近期内实现一定幅度的上涨。
然而,投资者仍需谨慎,密切关注市场变化,做好风险管理。加密货币市场向来波动剧烈,任何投资决策都应建立在充分的市场研究和个人风险承受能力的基础之上。

- 赞赏
- 5
- 5
- 转发
- 分享
SybilSlayer :
:
又涨 又是涨 没意思查看更多
币界网消息,8 月 22 日,消息人士:加拿大对美国汽车、钢铝的关税将维持不变。
- 赞赏
- 点赞
- 评论
- 转发
- 分享
- 赞赏
- 13
- 4
- 转发
- 分享
AMIRA123:
非常感谢您的宝贵信息和分享。祝您健康🌹🌹🌹🌺🌺🌺查看更多
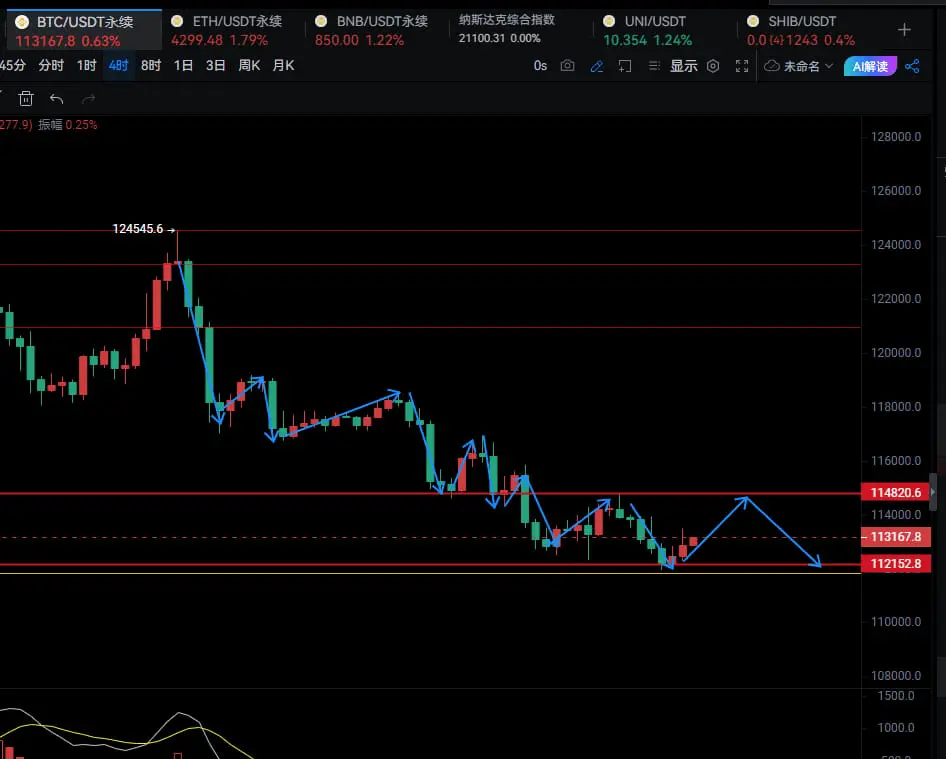
今日比特币市场呈现震荡上行趋势,为投资者带来了新的机遇与挑战。从技术面来看,比特币价格在11.2至11.5美元区间内进行调整,反映出市场的短期波动性。
四小时图表显示,当前价格处于调整浪的反弹区间,这一区间已为部分投资者带来了可观的收益,大约2500至3000个点的利润空间。
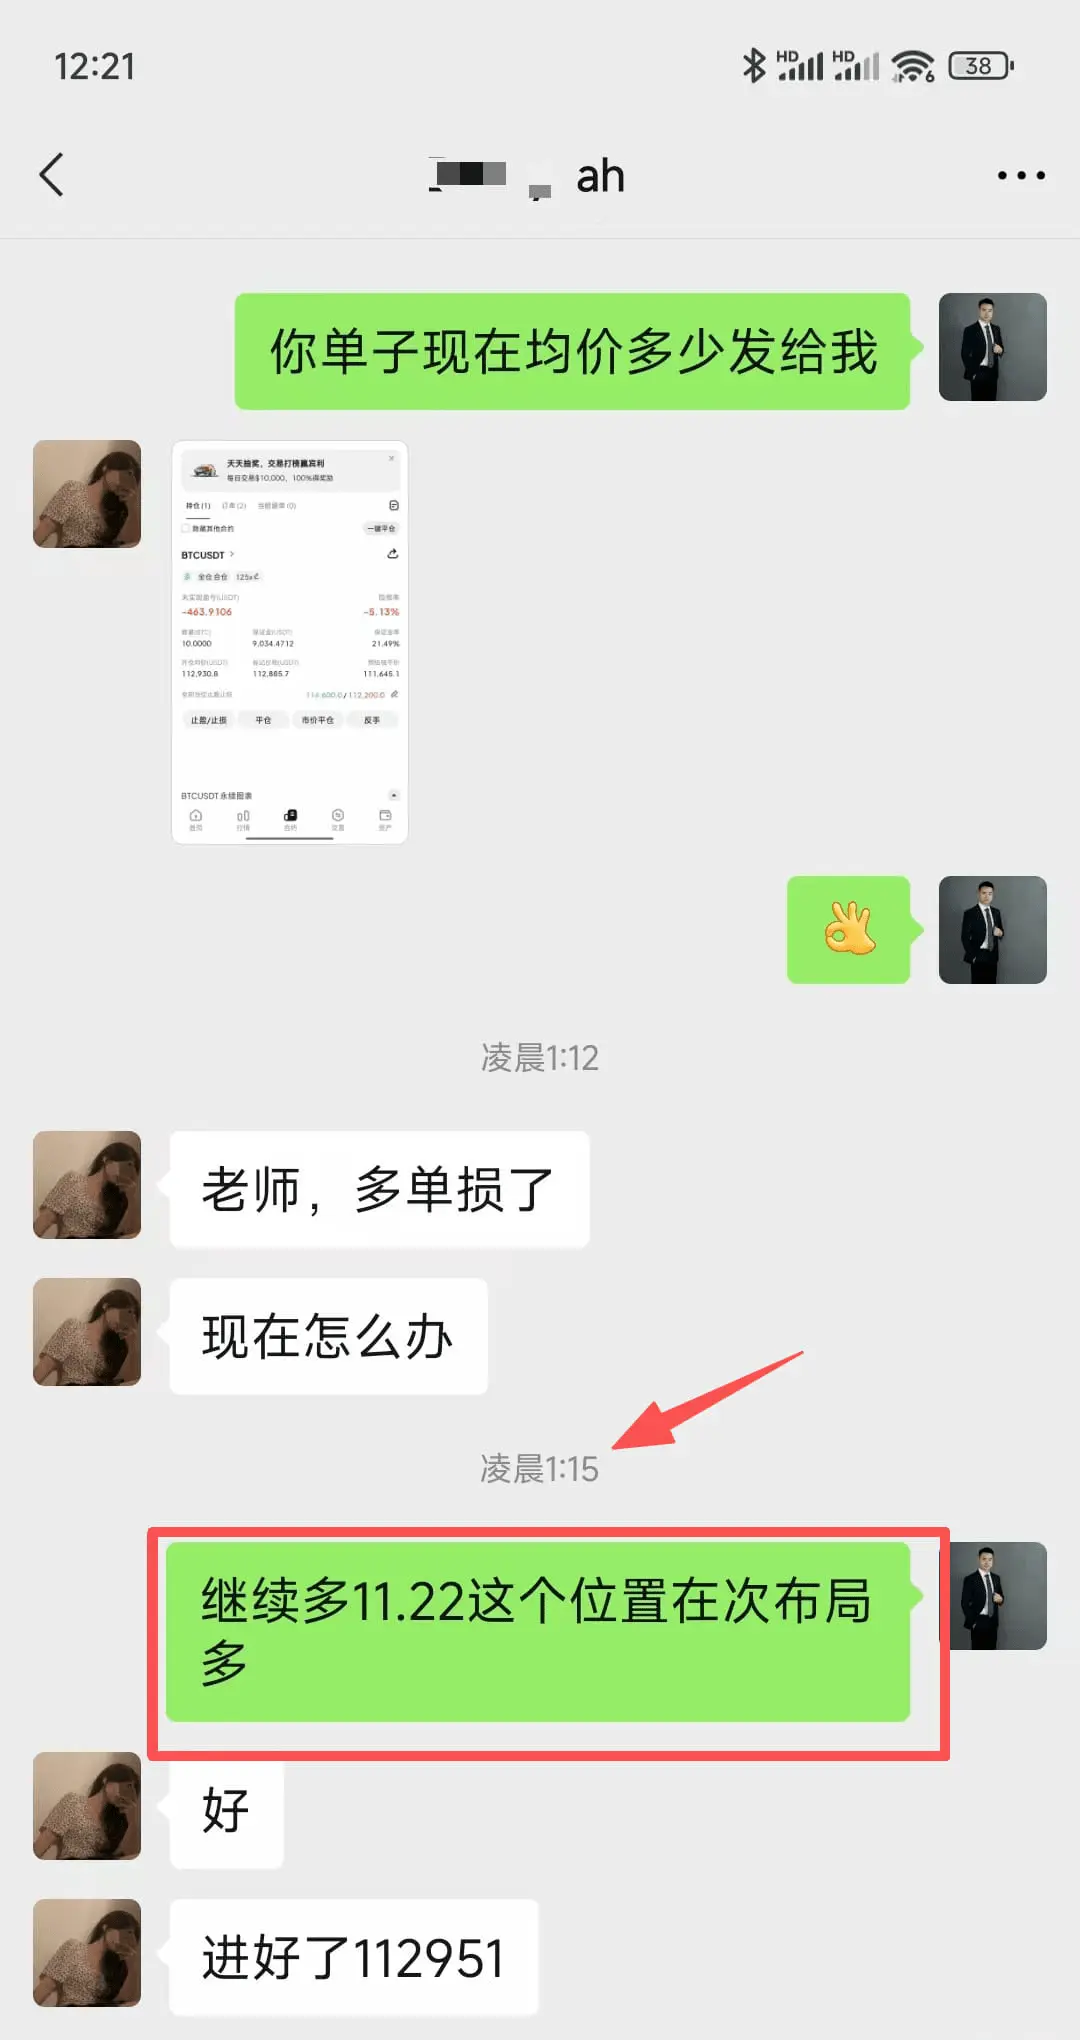
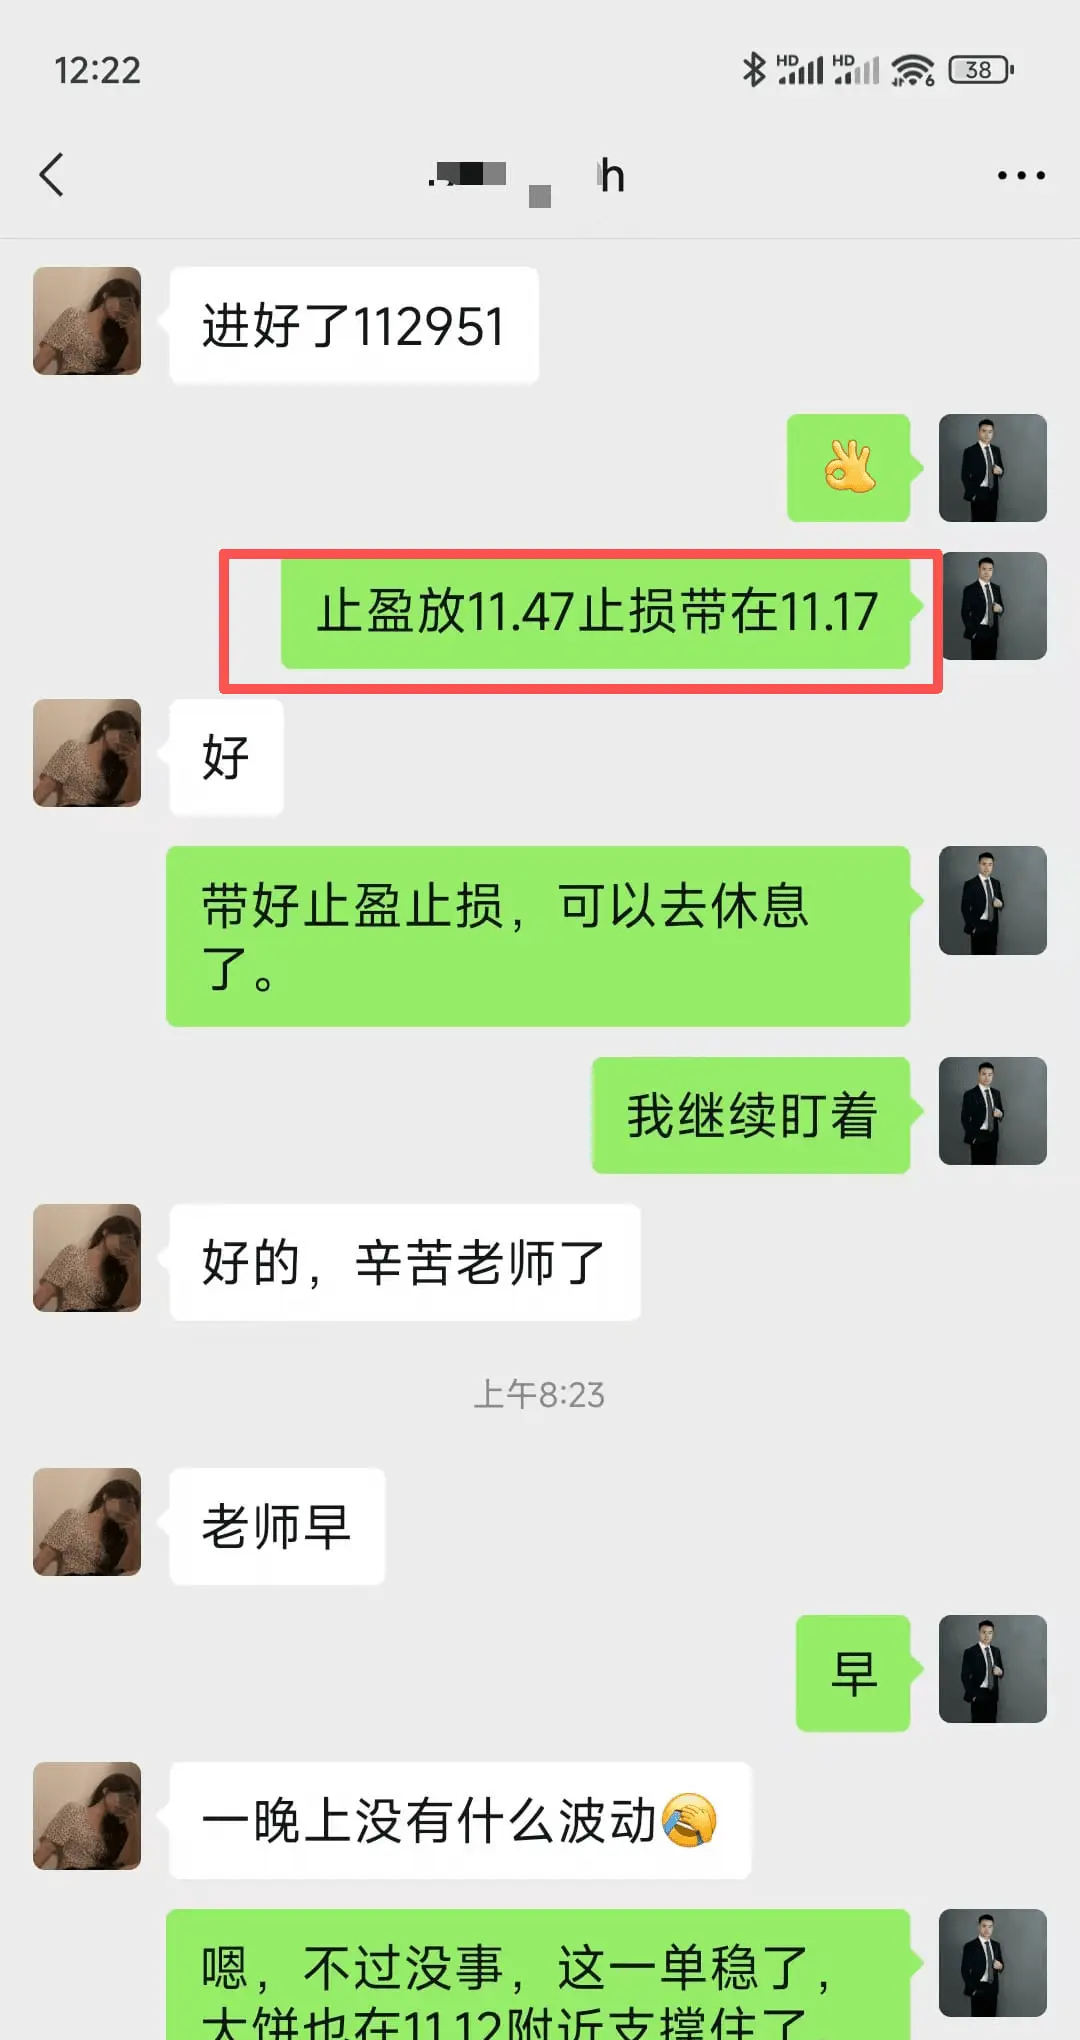
小时线图则揭示了比特币正在低位反弹的态势。对于错过昨晚入场机会的投资者,今日或许还有机会在低点建仓做多。然而,投资者需要谨慎看待上方11.47美元的潜在阻力位。
值得注意的是,昨日凌晨预测的11.2美元附近最低点位已经得到了市场验证,这为短期交易策略提供了重要参考。尽管如此,市场参与者仍需警惕价格波动带来的风险,合理设置止损并严格执行风险管理策略。
在当前市场环境下,投资者应密切关注各项技术指标和市场消息,以便及时调整交易策略。同时,也要认识到加密货币市场的高度不确定性,不要过度依赖单一分析方法或预测。
总的来说,当前比特币市场呈现出短期反弹的迹象,但投资者仍需保持谨慎,在把握潜在机会的同时,也要做好风险控制。
四小时图表显示,当前价格处于调整浪的反弹区间,这一区间已为部分投资者带来了可观的收益,大约2500至3000个点的利润空间。
小时线图则揭示了比特币正在低位反弹的态势。对于错过昨晚入场机会的投资者,今日或许还有机会在低点建仓做多。然而,投资者需要谨慎看待上方11.47美元的潜在阻力位。
值得注意的是,昨日凌晨预测的11.2美元附近最低点位已经得到了市场验证,这为短期交易策略提供了重要参考。尽管如此,市场参与者仍需警惕价格波动带来的风险,合理设置止损并严格执行风险管理策略。
在当前市场环境下,投资者应密切关注各项技术指标和市场消息,以便及时调整交易策略。同时,也要认识到加密货币市场的高度不确定性,不要过度依赖单一分析方法或预测。
总的来说,当前比特币市场呈现出短期反弹的迹象,但投资者仍需保持谨慎,在把握潜在机会的同时,也要做好风险控制。
BTC3.93%
- 赞赏
- 7
- 2
- 转发
- 分享
Wallet_Whisperer :
:
11.6就是顶点查看更多
- 赞赏
- 点赞
- 评论
- 转发
- 分享
加载更多
加入 3000 万人汇聚的头部社区
⚡️ 与 3000 万人一起参与加密货币热潮讨论
💬 与喜爱的头部博主互动
👍 查看感兴趣的内容
- 话题
12k 热度
206k 热度
29k 热度
178k 热度
4k 热度
推荐关注
换一批
比特一哥
仅分享个人观点,不构成买卖建议。
比特币教主
欢迎新朋友加入教主
asiftahsin
分享加密货币相关市场分析,分享加密货币相关知识给我的追随者(兄弟姐妹)
CopyTrading
社区优质活跃用户
小蚂蚁与比特币
一场游戏一场梦
暂无数据
- 置顶
- 🎤 为偶像应援 · Gate送你直达 Token of Love! 🎶
家人们,现在在Gate广场为 打 Token of Love CALL,20 张音乐节门票等你来瓜分!🔥
泫雅 / SUECO / DJ KAKA / CLICK#15 —— 你最期待谁?快来一起应援吧!
📌 参与方式(任选,参与越多中奖几率越高!)
1️⃣ 本帖互动
点赞 & 转发本帖 + 投票你最爱的艺人
评论区打出 “我在 Gate 广场为 Token of Love 打 Call !”
2️⃣ 广场发帖为 TA 打 Call
带上 #歌手名字# + #TokenOfLove#
发帖内容任选:
🎵 最想现场听到的歌 + 心情宣言
📣 应援口号(例:泫雅女王冲鸭!Gate广场全员打 Call!)
😎 自制表情包/海报/短视频(加分项,更容易中奖!)
3️⃣ 推特 / 小红书发帖打 Call
同样带上 #歌手名字# + #TokenOfLove#
内容同上,记得回链到表单 👉️ https://www.gate.com/questionnaire/7008
🎟️ 奖励安排
广场优质发帖用户:8张门票
广场幸运互动用户:2张门票
Twitter 优质发帖用户:5张门票
小红书优质发帖用户:5张门票
📌 优质帖文将根据文章丰富度、热度、创意度综合评分,禁止小号水贴,原创发帖更易获奖!
🕒 8 - ✈️ Gate 广场【Gate Travel 旅行分享官召集令】
广场家人们注意啦!Gate Travel 已经上线~ 机票+酒店一站式预订,还能用加密货币直接付款 💸
所以说,你的钱包和你的旅行梦终于可以谈恋爱了 😎 💕
现在广场开启 #GateTravel旅行分享官# 活动,邀你来秀旅行灵感 & 使用体验!💡
🌴 参与方式:
1️⃣ 在【广场】带话题 #Gate Travel 旅行分享官# 发帖
2️⃣ 你可以:
你最想用 Gate Travel 去的目的地(私藏小岛 or 网红打卡点都行)
讲讲用 Gate Travel 订票/订酒店的奇妙体验
放放省钱/使用攻略,让大家省到笑出声
或者直接写一篇轻松的 Gate Travel 旅行小故事
📦 奖励安排,走起:
🏆 优秀分享官(1 名):Gate 旅行露营套装
🎖️ 热门分享官(3 名):Gate 旅行速干套装
🎉 幸运参与奖(5 名):Gate 国际米兰旅行小夜灯
*海外用户 旅行露营套装 以 $100 合约体验券,旅行速干套装 以 $50 合约体验券折算,国际米兰旅行小夜灯以 $30合约体验券折算。
📌 优质内容将有机会得到官方账号转发翻牌提升社区曝光!
📌 帖文将综合互动量、内容丰富度和创意评分。禁止小号刷贴,原创分享更容易脱颖而出!
🕒 8月20 18:00 - 8月28日 24:00 UTC+ - 📢 Gate广场独家活动: #PUBLIC创作大赛# 正式开启!
参与 Gate Launchpool 第 297 期 — PublicAI (PUBLIC),并在 Gate广场发布你的原创内容,即有机会瓜分 4,000 枚 $PUBLIC 奖励池!
🎨 活动时间
2025年8月18日 10:00 – 2025年8月22日 16:00 (UTC)
📌 参与方式
在 Gate广场发布与 PublicAI (PUBLIC) 或当前 Launchpool 活动相关的原创内容
内容需不少于 100 字(可为分析、教程、创意图文、测评等)
添加话题: #PUBLIC创作大赛#
帖子需附带 Launchpool 参与截图(如质押记录、领取页面等)
🏆 奖励设置(总计 4,000 枚 $PUBLIC)
🥇 一等奖(1名):1,500 $PUBLIC
🥈 二等奖(3名):每人 500 $PUBLIC
🥉 三等奖(5名):每人 200 $PUBLIC
📋 评选标准
内容质量(相关性、清晰度、创意性)
互动热度(点赞、评论)
含有 Launchpool 参与截图的帖子将优先考虑
📄 注意事项
所有内容须为原创,严禁抄袭或虚假互动
获奖用户需完成 Gate广场实名认证
Gate 保留本次活动的最终解释权